Chrysler 2003 Annual Report Download - page 111
Download and view the complete annual report
Please find page 111 of the 2003 Chrysler annual report below. You can navigate through the pages in the report by either clicking on the pages listed below, or by using the keyword search tool below to find specific information within the annual report.-
 1
1 -
2
-
3
-
4
-
5
-
6
-
7
-
8
-
9
-
10
-
11
-
12
-
13
-
14
-
15
-
16
-
17
-
18
-
19
-
20
-
21
-
22
-
23
-
24
-
25
-
26
-
27
-
28
-
29
-
30
-
31
-
32
-
33
-
34
-
35
-
36
-
37
-
38
-
39
-
40
-
41
-
42
-
43
-
44
-
45
-
46
-
47
-
48
-
49
-
50
-
51
-
52
-
53
-
54
-
55
-
56
-
57
-
58
-
59
-
60
-
61
-
62
-
63
-
64
-
65
-
66
-
67
-
68
-
69
-
70
-
71
-
72
-
73
-
74
-
75
-
76
-
77
-
78
-
79
-
80
-
81
-
82
-
83
-
84
-
85
-
86
-
87
-
88
-
89
-
90
-
91
-
92
-
93
-
94
-
95
-
96
-
97
-
98
-
99
-
100
-
 101
101 -
 102
102 -
 103
103 -
 104
104 -
 105
105 -
 106
106 -
 107
107 -
 108
108 -
 109
109 -
 110
110 -
 111
111 -
 112
112 -
 113
113 -
 114
114 -
 115
115 -
 116
116 -
 117
117 -
 118
118 -
 119
119 -
 120
120 -
 121
121 -
122
-
123
-
124
-
125
-
126
-
127
-
128
-
129
-
130
-
131
-
132
-
133
-
134
-
135
-
136
-
137
-
138
-
139
-
140
-
141
-
142
-
143
-
144
-
145
-
146
-
147
-
148
-
149
-
150
-
151
-
152
-
153
-
154
-
155
-
156
-
157
-
158
-
159
-
160
-
161
-
162
-
163
-
164
-
165
-
166
-
167
-
168
-
169
-
170
-
171
-
172
-
173
-
174
-
175
-
176
-
177
-
178
-
179
-
180
-
181
-
182
-
183
-
184
-
185
-
186
-
187
-
188
-
189
-
190
-
191
-
192
-
193
-
194
-
195
-
196
-
197
-
198
-
199
-
200
-
201
-
202
-
203
-
204
-
205
-
206
-
207
-
208
-
209
 |
 |

110 Fiat Group Consolidated Financial Statements at December 31, 2003
Notes to the Consolidated Financial Statements
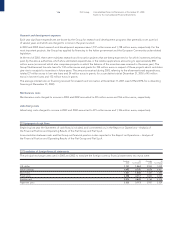
Investment income includes income from associated companies of 1 million euros (1 million euros in 2002) and from other companies
of 21 million euros (151 million euros in 2002), with a reduction of 130 million euros compared to 2002 due to the change in the scope
of consolidation owing to the sale of the Toro Assicurazioni Group (56 million euros).
Dividends were mainly received from minority investments valued at cost. This item included 68 million euros in 2002 for dividends
received on General Motors shares.
The Gains on sale of investments held in current assets decreased by 26 million mainly on account of the change in the scope
of consolidation due to the sale of the Toro Assicurazioni Group.
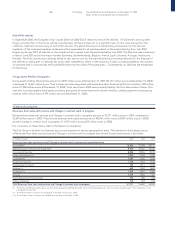
Other financial income
The following analysis of “Other financial income” and “Interest and other financial expenses” present the amounts shown in the
related captions on the statement of operations and also the amounts of income and expenses of the Group’s financial companies
presented in the captions on the statement of operations under “Revenues from sales and services” and “Interest and other
expenses of financial services companies”, respectively. The last line in the table shows “Other financial income” and “Interest
and other financial expenses” as presented on the statement of operations, excluding the financial activities.
(in millions of euros) 2003 2002 2001
Other financial income from:
receivables held as fixed assets from others 322
securities held as fixed assets other than equity investments –156 253
securities held as current assets other than equity investments 119 147 301
Other income from:
unconsolidated subsidiaries 825 11
associated companies 34 38 22
others:
bank and other interest 266 264 302
customer interest and lease income 1,166 2,010 2,154
discounts and other income 81 124 284
income from derivative financial instruments 1,132 1,603 1,075
foreign exchange gains, net 47 ––
Total from others 2,692 4,001 3,815
Total Other income 2,734 4,064 3,848
Total Other financial income 2,856 4,369 4,404
of which:
Other financial income, excluding financial services companies 1,504 2,219 2,188
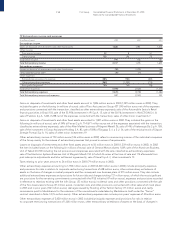
Interest and other financial expenses
(in millions of euros) 2003 2002 2001
Interest and other financial expenses from:
unconsolidated subsidiaries 323
associated companies 6210
others:
bond interest 681 769 625
bank interest 558 656 799
interest on trade and other payables 18 71 63
interest on notes payable 49 106 202
interest on other financial payables 185 273 343
discounts and other expenses 534 635 511
expenses from derivative financial instruments 1,115 1,492 1,255
losses on sale of securities 844 78
foreign exchange losses, net –111 147
Total Interest and other financial expenses - others 3,148 4,157 4,023
Total Interest and other financial expenses 3,157 4,161 4,036
of which:
Interest and other financial expenses, excluding financial services companies 2,489 3,046 3,132