Chrysler 2003 Annual Report Download - page 115
Download and view the complete annual report
Please find page 115 of the 2003 Chrysler annual report below. You can navigate through the pages in the report by either clicking on the pages listed below, or by using the keyword search tool below to find specific information within the annual report.-
 1
1 -
2
-
3
-
4
-
5
-
6
-
7
-
8
-
9
-
10
-
11
-
12
-
13
-
14
-
15
-
16
-
17
-
18
-
19
-
20
-
21
-
22
-
23
-
24
-
25
-
26
-
27
-
28
-
29
-
30
-
31
-
32
-
33
-
34
-
35
-
36
-
37
-
38
-
39
-
40
-
41
-
42
-
43
-
44
-
45
-
46
-
47
-
48
-
49
-
50
-
51
-
52
-
53
-
54
-
55
-
56
-
57
-
58
-
59
-
60
-
61
-
62
-
63
-
64
-
65
-
66
-
67
-
68
-
69
-
70
-
71
-
72
-
73
-
74
-
75
-
76
-
77
-
78
-
79
-
80
-
81
-
82
-
83
-
84
-
85
-
86
-
87
-
88
-
89
-
90
-
91
-
92
-
93
-
94
-
95
-
96
-
97
-
98
-
99
-
100
-
101
-
102
-
103
-
104
-
 105
105 -
 106
106 -
 107
107 -
 108
108 -
 109
109 -
 110
110 -
 111
111 -
 112
112 -
 113
113 -
 114
114 -
 115
115 -
 116
116 -
 117
117 -
 118
118 -
 119
119 -
 120
120 -
 121
121 -
 122
122 -
 123
123 -
 124
124 -
 125
125 -
126
-
127
-
128
-
129
-
130
-
131
-
132
-
133
-
134
-
135
-
136
-
137
-
138
-
139
-
140
-
141
-
142
-
143
-
144
-
145
-
146
-
147
-
148
-
149
-
150
-
151
-
152
-
153
-
154
-
155
-
156
-
157
-
158
-
159
-
160
-
161
-
162
-
163
-
164
-
165
-
166
-
167
-
168
-
169
-
170
-
171
-
172
-
173
-
174
-
175
-
176
-
177
-
178
-
179
-
180
-
181
-
182
-
183
-
184
-
185
-
186
-
187
-
188
-
189
-
190
-
191
-
192
-
193
-
194
-
195
-
196
-
197
-
198
-
199
-
200
-
201
-
202
-
203
-
204
-
205
-
206
-
207
-
208
-
209
 |
 |

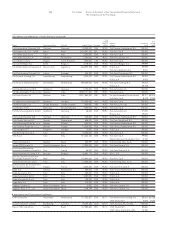
114 Fiat Group Consolidated Financial Statements at December 31, 2003
Notes to the Consolidated Financial Statements
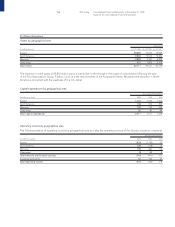
21 Other information
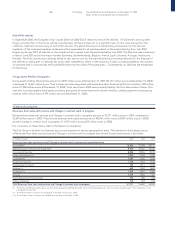
Assets by geographical area
Total Assets
(in millions of euros) At 12/31/2003 At 12/31/2002 At 12/31/2001
Europe 49,690 75,254 76,039
North America 9,200 12,013 15,353
Mercosur 2,890 3,451 6,939
Other areas 931 1,803 2,418
Total Assets 62,711 92,521 100,749
The reduction in total assets of 29,810 million euros is mainly due to the change in the scope of consolidation following the sale
of the Toro Assicurazioni Group, FiatAvio S.p.A. and the retail activities of the Automobile Sector. Moreover, the reduction in North
America is connected with the weakness of the U.S. dollar.
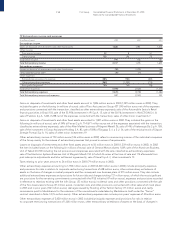
Capital expenditures by geographical area
Total Capital Expenditures
(in millions of euros) 2003 2002 2001
Europe 1,723 2,225 2,545
North America 138 313 555
Mercosur 120 150 249
Other areas 30 83 89
Total Capital expenditures 2,011 2,771 3,438
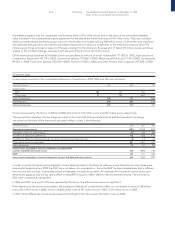
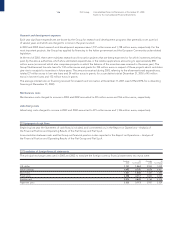
Operating income by geographical area
The following analysis of operating income by geographical area excludes the operating income of the Group’s insurance companies.
Total Operating Income
(in millions of euros) 2003 2002 2001
Europe (832) (1,136) 52
North America 139 (118) 15
Mercosur 135 260 176
Other areas (5)89 8
Total Industrial and Financial activities (563) (905) 251
Insurance companies 53 143 67
Total Operating income (510) (762) 318