Chrysler 2003 Annual Report Download - page 47
Download and view the complete annual report
Please find page 47 of the 2003 Chrysler annual report below. You can navigate through the pages in the report by either clicking on the pages listed below, or by using the keyword search tool below to find specific information within the annual report.-
 1
1 -
2
-
3
-
4
-
5
-
6
-
7
-
8
-
9
-
10
-
11
-
12
-
13
-
14
-
15
-
16
-
17
-
18
-
19
-
20
-
21
-
22
-
23
-
24
-
25
-
26
-
27
-
28
-
29
-
30
-
31
-
32
-
33
-
34
-
35
-
36
-
 37
37 -
 38
38 -
 39
39 -
 40
40 -
 41
41 -
 42
42 -
 43
43 -
 44
44 -
 45
45 -
 46
46 -
 47
47 -
 48
48 -
 49
49 -
 50
50 -
 51
51 -
 52
52 -
 53
53 -
 54
54 -
 55
55 -
 56
56 -
 57
57 -
58
-
59
-
60
-
61
-
62
-
63
-
64
-
65
-
66
-
67
-
68
-
69
-
70
-
71
-
72
-
73
-
74
-
75
-
76
-
77
-
78
-
79
-
80
-
81
-
82
-
83
-
84
-
85
-
86
-
87
-
88
-
89
-
90
-
91
-
92
-
93
-
94
-
95
-
96
-
97
-
98
-
99
-
100
-
101
-
102
-
103
-
104
-
105
-
106
-
107
-
108
-
109
-
110
-
111
-
112
-
113
-
114
-
115
-
116
-
117
-
118
-
119
-
120
-
121
-
122
-
123
-
124
-
125
-
126
-
127
-
128
-
129
-
130
-
131
-
132
-
133
-
134
-
135
-
136
-
137
-
138
-
139
-
140
-
141
-
142
-
143
-
144
-
145
-
146
-
147
-
148
-
149
-
150
-
151
-
152
-
153
-
154
-
155
-
156
-
157
-
158
-
159
-
160
-
161
-
162
-
163
-
164
-
165
-
166
-
167
-
168
-
169
-
170
-
171
-
172
-
173
-
174
-
175
-
176
-
177
-
178
-
179
-
180
-
181
-
182
-
183
-
184
-
185
-
186
-
187
-
188
-
189
-
190
-
191
-
192
-
193
-
194
-
195
-
196
-
197
-
198
-
199
-
200
-
201
-
202
-
203
-
204
-
205
-
206
-
207
-
208
-
209
 |
 |
Sales performance
In 2003, the weakness in the overall economy continued to have
an impact on the automobile market.
The Western European market for automobiles contracted by
1.2% compared with 2002, as a gain of 4.3% in Spain was offset
by a 6.4% drop in France. Demand held relatively steady in
Great Britain (+0.5%), Germany (-0.4%) and Italy (-1.2%). Outside
Western Europe, shipments were up sharply in Poland (+16.3%)
but continued to fall in Brazil (-3.2%).
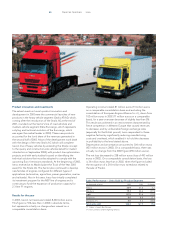
In Western Europe, shipments of light commercial vehicles
(slightly more than 1.7 million units) were down 2.0% from 2002.
Demand was down 17.4% in Italy but showed healthy increases
in Great Britain (+15.3%) and Spain (+8.8%). Outside Western
Europe, the best gain occurred in Poland (+20.5%).
Fiat Auto’s share of the Western European automobile market
declined to 7.4%, or 0.7 percentage points less than in 2002.
The trend was the same in Italy, where market share was 28%,
down 2.2 percentage points compared with 2002. In Brazil and
Poland, market share held at 25.2% and 17.8%, respectively.
Fiat Auto’s share of the Western European market for light
commercial vehicles reflected the same downward trend that
shaped overall demand, falling by 1.4 percentage points to
11.2%, the same level as in 2001.
Fiat Auto sold a total of about 1.7 million vehicles, or 8.8%
less than in 2002.
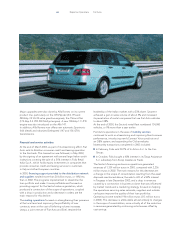
In Western Europe, unit sales were down 9.4%, due mainly to
the continuing and pervasive weakness that characterized
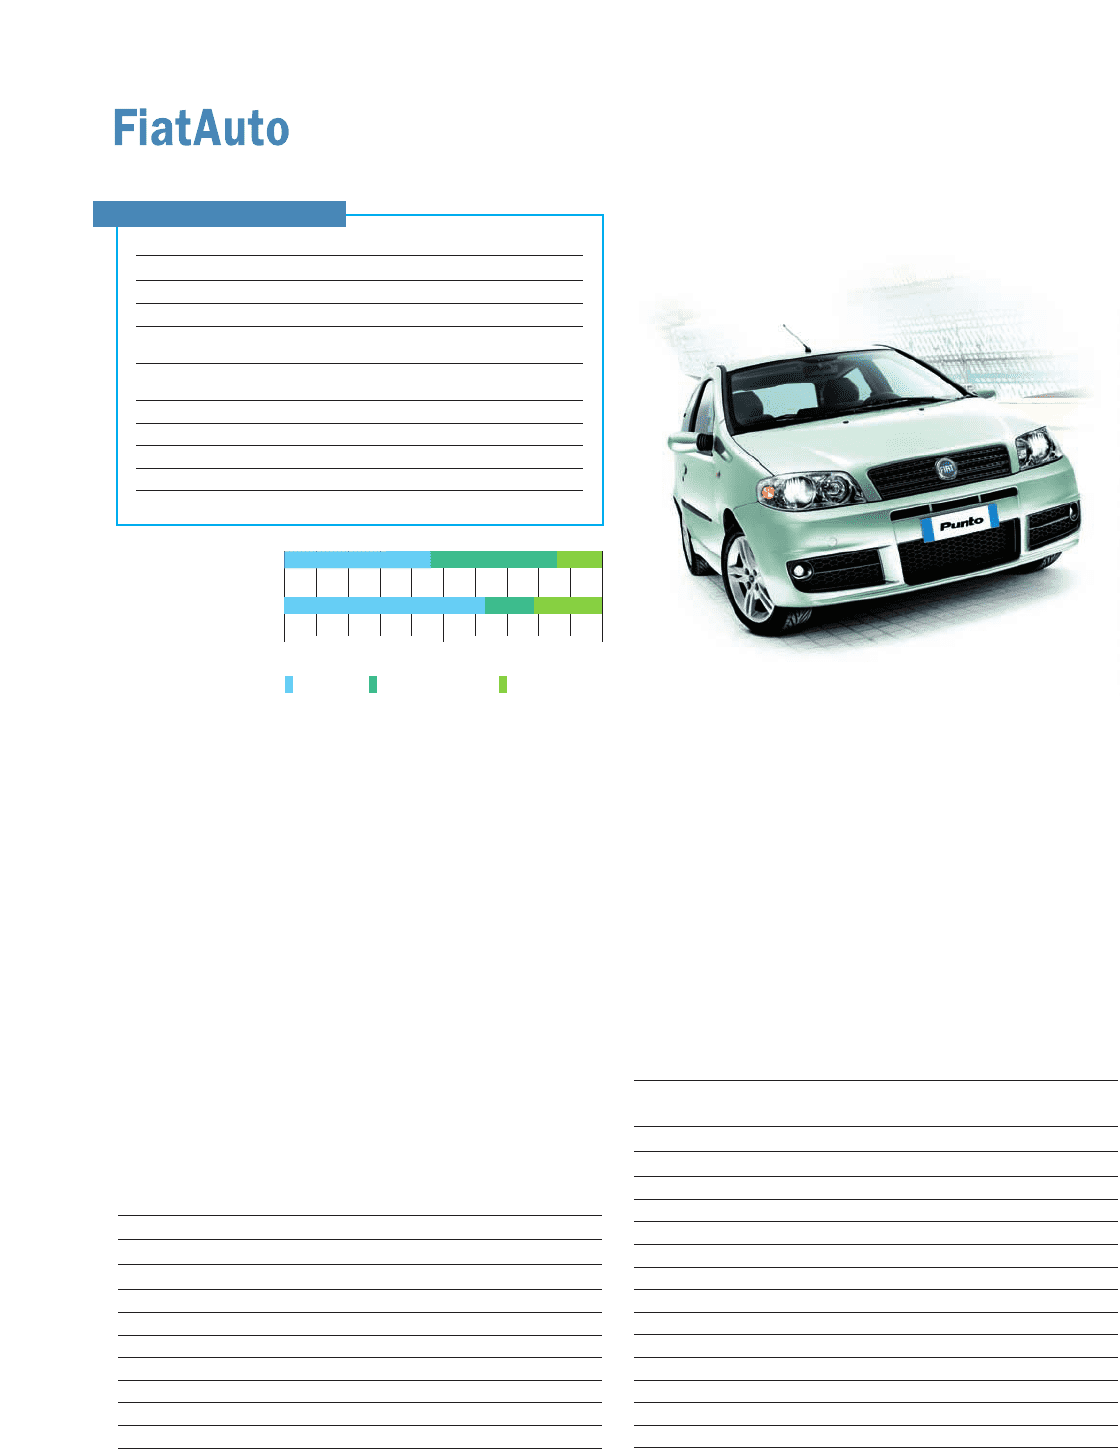
market demand and the fact that new models (Fiat Panda, Fiat
Idea, Lancia Ypsilon and Alfa GT) were not introduced until
late in 2003 and at the beginning of 2004. These new models
are showing good potential in terms of market penetration
and appeal to customers.
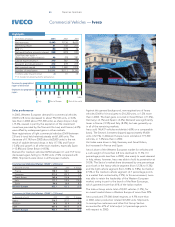
46 Report on Operations
Automobiles — Fiat Auto
(in millions of euros) 2003 2002 2001
Net revenues 20,010 22,147 24,440
Operating result (979)(1,343) (549)
EBIT (*) (1,607)(2,214) (1,061)
Net result before
minority interest (2,058)(2,739) (1,442)
Cash flow
(net result +
depreciation and amortization)
(1,096)(1,780) (292)
Capital expenditures 1,100 1,115 1,331
Research and development 939 861 870
Net invested capital 1,806 1,254 2,340
Number of employees 44,563 49,544 55,174
(*) It includes non-operating income and expenses
Highlights
Italy Rest of Europe Rest of the world
Revenues by geographical
region of destination
Employees by geographical
region
0 50% 100%
Automobile Market
(in thousands of units) 2003 2002 % change
France 2,003 2,139 (6.4)
Germany 3,174 3,188 (0.4)
Great Britain 2,586 2,572 0.5
Italy 2,251 2,280 (1.2)
Spain 1,380 1,322 4.3
Western Europe 14,146 14,323 (1.2)
Poland 353 303 16.3
Brazil 1,195 1,235 (3.2)
Sales Performance –Automobiles and Light
Commercial Vehicles
(in thousands of units) 2003 2002 % change
France 82.0 98.0 (16.3)
Germany 118.8 122.8 (3.3)
Great Britain 92.3 91.0 1.4
Italy 671.2 758.7 (11.5)
Spain 76.3 66.5 14.8
Rest of Western Europe 138.8 165.2 (16.0)
Western Europe 1,179.4 1,302.2 (9.4)
Poland 70.3 60.7 15.9
Brazil 317.7 358.0 (11.3)
Rest of the world 128.1 139.2 (8.0)
Total units sold 1,695.5 1,860.1 (8.8)
Associated companies 83.0 49.8 66.5
Grand total 1,778.5 1,909.9 (6.9)