Chrysler 2003 Annual Report Download - page 32
Download and view the complete annual report
Please find page 32 of the 2003 Chrysler annual report below. You can navigate through the pages in the report by either clicking on the pages listed below, or by using the keyword search tool below to find specific information within the annual report.-
 1
1 -
2
-
3
-
4
-
5
-
6
-
7
-
8
-
9
-
10
-
11
-
12
-
13
-
14
-
15
-
16
-
17
-
18
-
19
-
20
-
21
-
 22
22 -
 23
23 -
 24
24 -
 25
25 -
 26
26 -
 27
27 -
 28
28 -
 29
29 -
 30
30 -
 31
31 -
 32
32 -
 33
33 -
 34
34 -
 35
35 -
 36
36 -
 37
37 -
 38
38 -
 39
39 -
 40
40 -
 41
41 -
 42
42 -
43
-
44
-
45
-
46
-
47
-
48
-
49
-
50
-
51
-
52
-
53
-
54
-
55
-
56
-
57
-
58
-
59
-
60
-
61
-
62
-
63
-
64
-
65
-
66
-
67
-
68
-
69
-
70
-
71
-
72
-
73
-
74
-
75
-
76
-
77
-
78
-
79
-
80
-
81
-
82
-
83
-
84
-
85
-
86
-
87
-
88
-
89
-
90
-
91
-
92
-
93
-
94
-
95
-
96
-
97
-
98
-
99
-
100
-
101
-
102
-
103
-
104
-
105
-
106
-
107
-
108
-
109
-
110
-
111
-
112
-
113
-
114
-
115
-
116
-
117
-
118
-
119
-
120
-
121
-
122
-
123
-
124
-
125
-
126
-
127
-
128
-
129
-
130
-
131
-
132
-
133
-
134
-
135
-
136
-
137
-
138
-
139
-
140
-
141
-
142
-
143
-
144
-
145
-
146
-
147
-
148
-
149
-
150
-
151
-
152
-
153
-
154
-
155
-
156
-
157
-
158
-
159
-
160
-
161
-
162
-
163
-
164
-
165
-
166
-
167
-
168
-
169
-
170
-
171
-
172
-
173
-
174
-
175
-
176
-
177
-
178
-
179
-
180
-
181
-
182
-
183
-
184
-
185
-
186
-
187
-
188
-
189
-
190
-
191
-
192
-
193
-
194
-
195
-
196
-
197
-
198
-
199
-
200
-
201
-
202
-
203
-
204
-
205
-
206
-
207
-
208
-
209
 |
 |

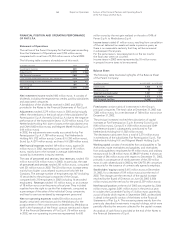
Financial Activities
Financial Activities generated net revenues of 1,870 million
euros in 2003, approximately 19% lower than the 2,305 million
euros generated in 2002.
The reduction in revenues is mainly attributable to lower interest
rates, portfolio selection policies, and the negative effect of the
strengthening of the euro against the dollar. Disposals in the
mobility services segment of the Automobile Sector also had
a negative impact, which was partially offset by consolidation
by the Commercial Vehicles Sector for the entire year of a
company that operates in the field of financing sales outside
Western Europe.
The result before taxes of normal Financial Activities (which
does not include the impact of the result of equity investments
owned by the financial companies in industrial companies)
totaled -22 million euros, compared with +180 million euros
in fiscal 2002.
This decrease is mainly attributable to a lower result from
equity investments, in particular the company Leasys, and
higher net non-operating expenses, which amounted to 119
million euros (positive balance of 35 million euros in 2002)
and derive in particular from revision of the operating and
organizational processes of the rental companies of the
Automobile Sector, and the residual loss caused by the
sale of Fraikin.
Discontinuing Operations
The net revenues of discontinuing operations totaled 2,949
million euros in 2003 and included the first six months of
2003 for FiatAvio S.p.A. (623 million euros, compared with
1,499 million euros in 2002), the first four months of 2003 for
the Toro Assicurazioni Group (1,654 million euros compared
with 4,916 million euros in 2002), the revenues of the companies
sold to Fidis Retail Italia during the year and the one that is still
to be sold (617 million euros compared with 739 million euros
in 2002), and the first quarter of the Brazilian retail financing
activities of Fiat Auto (55 million euros compared with 349
million euros in 2002). Furthermore, fiscal 2002 included
the revenues of IPI (31 million euros) and Fraikin (517 million euros).
The operating income of discontinuing operations in 2003
totaled 204 million euros, consisting of: six months of FiatAvio
S.p.A. (54 million euros compared with 218 million euros in
2002), the first four months of 2003 for the Toro Assicurazioni
Group (35 million euros compared with 108 million euros in
2002), the operating income of the companies sold to Fidis
Retail Italia during the year and the one that is still to be sold
(108 million euros compared with 142 million euros in 2002),
and the first quarter of the Brazilian retail financing activities
of Fiat Auto (7 million euros against 77 million euros in 2002).
Furthermore, fiscal 2002 included the operating income of
IPI (21 million euros) and Fraikin (20 million euros).
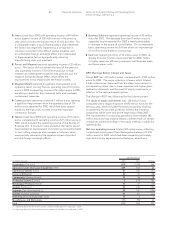
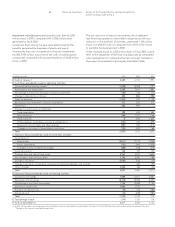
31 Report on Operations Analysis of the Financial Position and Operating Results
of the Fiat Group and Fiat S.p.A
2003 2002
Industrial Financial Discontinuing Industrial Financial Discontinuing
(in millions of euros) Consolidated Activities Activities Operations Consolidated Activities Activities Operations
Net revenues 47,271 43,380 1,870 2,949 55,649 46,624 2,305 8,051
Cost of sales 40,830 37,985 1,235 2,538 48,619 41,230 1,622 7,098
Gross operating result 6,441 5,395 635 411 7,030 5,394 683 953
Overhead 4,748 4,186 323 239 5,782 4,778 414 590
Research and development 1,747 1,724 – 23 1,748 1,694 – 54
Other operating income (expenses) (456)(423)(88)55 (262) (507) (32) 277
Operating result (510)(938)224 204 (762) (1,585) 237 586
Investment income (expenses) (*) (156)(16)(63)(46) (690) (282) 3 (360)
Non-operating income (expenses) (**) 347 478 (119)(12) (2,503) (2,302) 35 (236)
EBIT (319)(476)42 146 (3,955) (4,169) 275 (10)
Financial income (expenses) (979)(1,003)(64)88 (862) (999) (95) 232
Result before taxes (1,298)(1,479)(22)234 (4,817) (5,168) 180 222
Income taxes 650 486 55 109 (554) (751) 52 145
Net result of normal operations (1,948)(1,965)(77)125 (4,263) (4,417) 128 77
Result of intersegment investments –13(326)–– 141 (286) (14)
Net result before minority interest (1,948)(1,952)(403)125 (4,263) (4,276) (158) 63
(*) This item includes investment income (expenses) as well as writedowns and upward adjustments in non-intersegment equity investments valued using the equity method.
(**) The 2003 figure for Industrial Activities includes 1,766 million euros in net gains on disposals of assets, while the figure for Financial Activities includes a net loss on disposals
of 24 million euros.