Chrysler 2003 Annual Report Download - page 23
Download and view the complete annual report
Please find page 23 of the 2003 Chrysler annual report below. You can navigate through the pages in the report by either clicking on the pages listed below, or by using the keyword search tool below to find specific information within the annual report.-
 1
1 -
2
-
3
-
4
-
5
-
6
-
7
-
8
-
9
-
10
-
11
-
12
-
 13
13 -
 14
14 -
 15
15 -
 16
16 -
 17
17 -
 18
18 -
 19
19 -
 20
20 -
 21
21 -
 22
22 -
 23
23 -
 24
24 -
 25
25 -
 26
26 -
 27
27 -
 28
28 -
 29
29 -
 30
30 -
 31
31 -
 32
32 -
 33
33 -
34
-
35
-
36
-
37
-
38
-
39
-
40
-
41
-
42
-
43
-
44
-
45
-
46
-
47
-
48
-
49
-
50
-
51
-
52
-
53
-
54
-
55
-
56
-
57
-
58
-
59
-
60
-
61
-
62
-
63
-
64
-
65
-
66
-
67
-
68
-
69
-
70
-
71
-
72
-
73
-
74
-
75
-
76
-
77
-
78
-
79
-
80
-
81
-
82
-
83
-
84
-
85
-
86
-
87
-
88
-
89
-
90
-
91
-
92
-
93
-
94
-
95
-
96
-
97
-
98
-
99
-
100
-
101
-
102
-
103
-
104
-
105
-
106
-
107
-
108
-
109
-
110
-
111
-
112
-
113
-
114
-
115
-
116
-
117
-
118
-
119
-
120
-
121
-
122
-
123
-
124
-
125
-
126
-
127
-
128
-
129
-
130
-
131
-
132
-
133
-
134
-
135
-
136
-
137
-
138
-
139
-
140
-
141
-
142
-
143
-
144
-
145
-
146
-
147
-
148
-
149
-
150
-
151
-
152
-
153
-
154
-
155
-
156
-
157
-
158
-
159
-
160
-
161
-
162
-
163
-
164
-
165
-
166
-
167
-
168
-
169
-
170
-
171
-
172
-
173
-
174
-
175
-
176
-
177
-
178
-
179
-
180
-
181
-
182
-
183
-
184
-
185
-
186
-
187
-
188
-
189
-
190
-
191
-
192
-
193
-
194
-
195
-
196
-
197
-
198
-
199
-
200
-
201
-
202
-
203
-
204
-
205
-
206
-
207
-
208
-
209
 |
 |

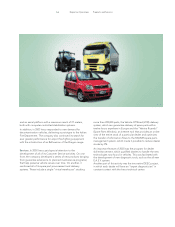
❚Teksid, with revenues of 844 million euros, reported a sharp
decrease with respect to the 1,539 million euros reported in
the previous year, due to the sale on September 30, 2002
of the Aluminum Business Unit. On a comparable
consolidation basis and excluding the negative foreign
exchange effect, revenues would have increased by 3.7%
thanks to higher volumes in the Magnesium Business Unit,
largely in consequence of demand from the SUV segment
particularly in the United States, and in the Cast Iron
Business Unit.
❚Business Solutions reported revenues of 1,816 million euros,
down 7.6% from the previous year. In addition to the effect
of disposals, this result reflected the slowdown in the services
market and the refocusing of Sector activities on Fiat Group
companies.
❚Itedi reported revenues of 383 million euros, 6.4% higher
than in fiscal 2002. This improvement derived from higher
advertising revenues, brand-stretching initiatives, and sales
of the weekly “Specchio,” which offset the decrease
stemming from lower daily newspaper sales.
Operating Result
The operating result reflected a reduction in losses, which
decreased from 762 million euros in 2002 to 510 million euros
in 2003. The improvement is even more evident if the
performance of Continuing Operations alone is considered,
which reported a 634 million euros decrease in operating loss
(from a loss of 1,348 million euros in 2002 to a loss of 714 million
euros in 2003). The recovery accelerated over the course of the
year, reflecting the efficiency gains realized through
implementation of the Relaunch Plan.
During 2003, research and development outlays, which are
posted directly to the statement of operations and thus
included in the operating result, totaled 1,747 million euros.
This amount, virtually unchanged from fiscal 2002, reflects the
effects of changes in the scope of consolidation and the negative
effect of changes in currency conversion rates. If these effects
were excluded, the Group would have posted higher R&D
outlays deriving from higher expenses at Fiat Auto, as part of its
strategy to renew its product range, and at Ferrari and Maserati,
which further increased its commitment to innovation.
The operating result broken down by Sector is illustrated below:
❚Fiat Auto reduced its operating loss from 1,343 million euros
in fiscal 2002 to 979 million euros in 2003. On a comparable
basis – excluding from both years the results of the financial
companies that were sold – the reduction in losses totaled
468 million euros. This improvement is the result of savings
on product costs and overhead deriving from the cost
reduction plan and industrial synergies generated by the
alliance with General Motors; on the other hand, the Sector
suffered from the negative effects of lower volumes and
higher research and development costs.
Finally, the annual result realized only marginal benefits
from the new products that were introduced on the market
in the final months of the year.
❚CNH posted operating income of 229 million euros in
2003, up from the 163 million euros reported for 2002,
notwithstanding the negative foreign exchange effect
stemming from appreciation of the euro. The Sector result
improved markedly thanks to improved margins on new
products, higher sales prices, and cost savings realized
through the integration plans with Case and the Relaunch
Plan.
These factors more than compensated for the negative
impact of volumes and product mix, the costs associated
with the introduction of new products, and higher social
security and medical costs for its employees.
22 Report on Operations Analysis of the Financial Position and Operating Results
of the Fiat Group and Fiat S.p.A
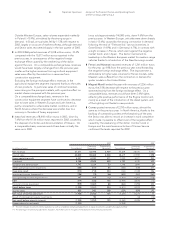
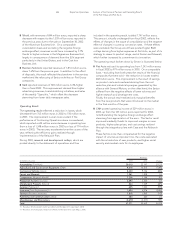
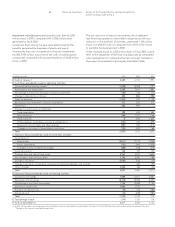
Revenues
(in millions of euros) 2003 2002 Change
Automobiles (Fiat Auto) 20,010 22,147 (2,137)
Agricultural and Construction Equipment (CNH) 9,418 10,513 (1,095)
Commercial Vehicles (Iveco) 8,440 9,136 (696)
Ferrari and Maserati 1,261 1,208 53
Components (Magneti Marelli) 3,206 3,288 (82)
Production Systems (Comau) 2,293 2,320 (27)
Metallurgical Products (Teksid) 844 1,539 (695)
Aviation (FiatAvio) (*) 625 1,534 (909)
Insurance (Toro Assicurazioni) (**) 1,654 4,916 (3,262)
Services (Business Solutions) 1,816 1,965 (149)
Publishing and Communications (Itedi) 383 360 23
Miscellaneous and Eliminations (2,679) (3,277) 598
Total 47,271 55,649 (8,378)
(*) Revenues for the Aviation Sector are shown until the date of its sale (July 1, 2003).
(**) Revenues for the Insurance Sector are shown until the date of its sale (May 2, 2003).