Chrysler 2003 Annual Report Download - page 54
Download and view the complete annual report
Please find page 54 of the 2003 Chrysler annual report below. You can navigate through the pages in the report by either clicking on the pages listed below, or by using the keyword search tool below to find specific information within the annual report.
Sales performance
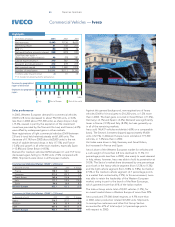
In 2003, Western European demand for commercial vehicles
(GVW ≥2.8 tons) decreased to about 952,100 units, or 0.6%
less than in 2002 (about 957,500 units), as sharp drops in Italy
(-15.6%, caused in part by the expiration of the investment
incentives provided by the Tremonti Bis Law) and France (-6.0%)
were offset by widespread gains in other markets.
New registrations of light commercial vehicles (GVW between
2.8 and 6 tons) held relatively steady at 661,600 units. The
decrease of 0.1% from 2002 (about 662,000 units) is the net
result of sizable demand drops in Italy (-17.5%) and France
(-3.6%) and growth in all other main markets, especially Spain
(+12.8%) and Great Britain (+8.5%).
Demand for medium vehicles (GVW between 6.1 and 15.9 tons)
decreased again, falling to 74,300 units (-9.2% compared with
2002). Shipments were down in all European markets.
Against this general background, new registrations of heavy
vehicles (GVW ≥16 tons) grew to 216,200 units, or 1.2% more
than in 2002. The best gains occurred in Great Britain (+11.4%),
Germany (+6.1%) and Spain (+4.4%). Demand was significantly
lower in France (-9.5%) and Italy (-8.0%), but was generally up
in all of the remaining markets.
Iveco sold 146,437 vehicles worldwide (-6.8% on a comparable
basis). The Sector’s licensees shipped approximately 49,600
units (+32.1%). In Western Europe, Iveco sold about 119,300
vehicles, or 7.4% less than in 2002.
Unit sales were down in Italy, Germany and Great Britain,
but increased in France and Spain.
Iveco’s share of the Western European market for vehicles with
a curb weight of more than 2.8 tons declined to 11.5% (1.3
percentage points less than in 2002), due mainly to weak demand
in Italy, where, however, Iveco was able to hold its penetration at
30.5%. The Sector’s market share decreased by one percentage
point both in the heavy-vehicle segment (from 12.3% to11.3%)
and the light-vehicle segment (from 10.8% to 9.8%), but held at
27.4% in the medium-vehicle segment (-2.7 percentage points
in a market that contracted by 9.2%). In this environment, Iveco
was able to retain the leadership of the Western European
market, owing in part to the launch of the New Eurocargo,
which garnered more than 61% of the Italian market.
The Irisbus Group sold a total of 8,307 vehicles (-1.5%), for
an overall market share in Western Europe of more than 25%.
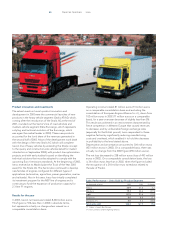
Iveco produced 379,000 diesel engines, or 4.9% more than
in 2002, when production totaled 361,200 units. Shipments
to noncaptive customers and other Fiat Group Sectors
accounted for 61% of total output (+3 percentage points
with respect to 2002).
53 Report on Operations
Commercial Vehicles — Iveco
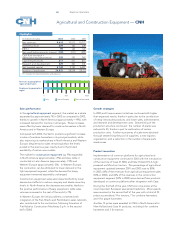
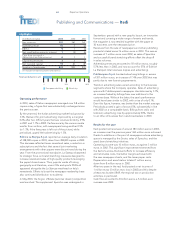
(in millions of euros) 2003 2002 2001
Net revenues 8,440 9,136 8,650
Operating result 81 102 271
EBIT (**) (84)(409) 46
Net result before minority interest (258)(493) (123)
Cash flow
(net result +
depreciation and amortization)
46 (70) 287
Capital expenditures (*) 210 587 718
Research and development 212 239 215
Net invested capital 1,310 1,582 1,979
Number of employees 31,511 38,113 35,340
(*) Vehicles under long-term rentals 28 331 348
(**) It includes non-operating income and expenses
Highlights
Italy Rest of Europe Rest of the world
Revenues by geographical
region of destination
Employees by geographical
region
0 50% 100%
Commercial Vehicles Market (GVW ≥2.8 tons)
(in thousands of units) 2003 2002 % change
France 158.5 168.7 (6.0)
Germany 211.0 207.3 1.8
Great Britain 165.6 153.6 7.8
Italy 117.7 139.5 (15.6)
Spain 94.6 86.9 8.9
Western Europe 952.1 957.5 (0.6)
Commercial Vehicles Market (GVW ≥2.8 tons)
(in thousands of units) 2003 2002 % change
Heavy 216.2 213.7 1.2
Medium 74.3 81.9 (9.2)
Light 661.6 662.0 (0.1)
Western Europe 952.1 957.5 (0.6)


