Chrysler 2003 Annual Report Download - page 109
Download and view the complete annual report
Please find page 109 of the 2003 Chrysler annual report below. You can navigate through the pages in the report by either clicking on the pages listed below, or by using the keyword search tool below to find specific information within the annual report.-
 1
1 -
2
-
3
-
4
-
5
-
6
-
7
-
8
-
9
-
10
-
11
-
12
-
13
-
14
-
15
-
16
-
17
-
18
-
19
-
20
-
21
-
22
-
23
-
24
-
25
-
26
-
27
-
28
-
29
-
30
-
31
-
32
-
33
-
34
-
35
-
36
-
37
-
38
-
39
-
40
-
41
-
42
-
43
-
44
-
45
-
46
-
47
-
48
-
49
-
50
-
51
-
52
-
53
-
54
-
55
-
56
-
57
-
58
-
59
-
60
-
61
-
62
-
63
-
64
-
65
-
66
-
67
-
68
-
69
-
70
-
71
-
72
-
73
-
74
-
75
-
76
-
77
-
78
-
79
-
80
-
81
-
82
-
83
-
84
-
85
-
86
-
87
-
88
-
89
-
90
-
91
-
92
-
93
-
94
-
95
-
96
-
97
-
98
-
 99
99 -
 100
100 -
 101
101 -
 102
102 -
 103
103 -
 104
104 -
 105
105 -
 106
106 -
 107
107 -
 108
108 -
 109
109 -
 110
110 -
 111
111 -
 112
112 -
 113
113 -
 114
114 -
 115
115 -
 116
116 -
 117
117 -
 118
118 -
 119
119 -
120
-
121
-
122
-
123
-
124
-
125
-
126
-
127
-
128
-
129
-
130
-
131
-
132
-
133
-
134
-
135
-
136
-
137
-
138
-
139
-
140
-
141
-
142
-
143
-
144
-
145
-
146
-
147
-
148
-
149
-
150
-
151
-
152
-
153
-
154
-
155
-
156
-
157
-
158
-
159
-
160
-
161
-
162
-
163
-
164
-
165
-
166
-
167
-
168
-
169
-
170
-
171
-
172
-
173
-
174
-
175
-
176
-
177
-
178
-
179
-
180
-
181
-
182
-
183
-
184
-
185
-
186
-
187
-
188
-
189
-
190
-
191
-
192
-
193
-
194
-
195
-
196
-
197
-
198
-
199
-
200
-
201
-
202
-
203
-
204
-
205
-
206
-
207
-
208
-
209
 |
 |

108 Fiat Group Consolidated Financial Statements at December 31, 2003
Notes to the Consolidated Financial Statements
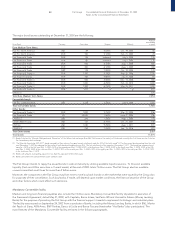
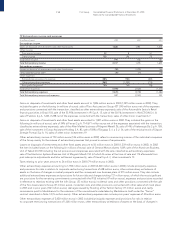
Net revenues by area of destination may be analyzed as follows:
(in millions of euros) 2003 2002 2001
Revenues from sales and services and Change in contract work in progress by destination
Italy 16,381 20,120 19,954
Europe (excluding Italy) 18,884 21,072 22,541
North America 5,920 7,411 7,531
Mercosur 2,595 3,268 4,221
Other areas 3,491 3,778 3,759
Total Revenues from sales and services and Change in contract work in progress 47,271 55,649 58,006
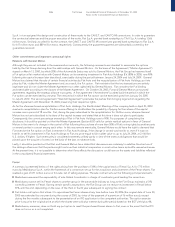
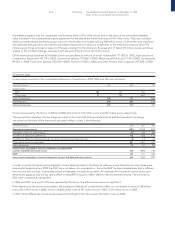
Other income and revenues
(in millions of euros) 2003 2002 2001
Revenue grants 52 47 79
Capital gains 187 290 383
Prior period income 423 518 476
Investment grants 78 114 93
Other income 949 1,183 1,214
Total Other income and revenues 1,689 2,152 2,245
Capital gains from the sale of fixed assets of 187 million euros (290 million euros in 2002) mainly relate to disposals of non-strategic
activities as a consequence of the policy to reduce invested capital. The gains realized on the sale of non-strategic buildings total
157 million euros (159 million euros in 2002).
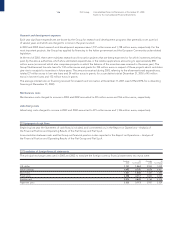
16 Costs of production
Costs of production amount to 50,858 million euros (58,854 million euros in 2002), a decrease of 13.6% compared to 2002. On a
comparable consolidation basis, the reduction would be 5.3%. The main components of this item and the changes that occurred
during the period can be described as follows:
Raw materials, supplies and merchandise
Raw materials, supplies and merchandise amount to 28,392 million euros, a decrease of 6.3% compared to 2002 (-5.2% on
a comparable consolidation basis). Raw materials, supplies and merchandise as a percentage of revenues, on a comparable
consolidation basis, would be 63% (62.5% in 2002).
Services
Services amount to 8,505 million euros, a decrease of 14% compared to 2002 (-7.8% on a comparable consolidation basis). This
amount is equal to 18% of revenues (17.8% in 2002). On a comparable consolidation basis, the percentage of services expenses to
revenues would be 18.4% (18.7% in 2002). Services include advertising costs, external information technology and telecommunication
service costs, external maintenance costs and transportation costs.
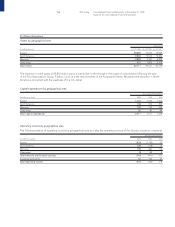
Personnel
Personnel costs consist of the following:
(in millions of euros) 2003 2002 2001
Salaries and wages 4,707 5,457 5,862
Social security contributions 1,249 1,365 1,551
Employee severance indemnities 244 256 315
Employee pensions and similar obligations 185 100 122
Other costs 303 376 319
Total Personnel costs 6,688 7,554 8,169