Chrysler 2003 Annual Report Download - page 35
Download and view the complete annual report
Please find page 35 of the 2003 Chrysler annual report below. You can navigate through the pages in the report by either clicking on the pages listed below, or by using the keyword search tool below to find specific information within the annual report.-
 1
1 -
2
-
3
-
4
-
5
-
6
-
7
-
8
-
9
-
10
-
11
-
12
-
13
-
14
-
15
-
16
-
17
-
18
-
19
-
20
-
21
-
22
-
23
-
24
-
 25
25 -
 26
26 -
 27
27 -
 28
28 -
 29
29 -
 30
30 -
 31
31 -
 32
32 -
 33
33 -
 34
34 -
 35
35 -
 36
36 -
 37
37 -
 38
38 -
 39
39 -
 40
40 -
 41
41 -
 42
42 -
 43
43 -
 44
44 -
 45
45 -
46
-
47
-
48
-
49
-
50
-
51
-
52
-
53
-
54
-
55
-
56
-
57
-
58
-
59
-
60
-
61
-
62
-
63
-
64
-
65
-
66
-
67
-
68
-
69
-
70
-
71
-
72
-
73
-
74
-
75
-
76
-
77
-
78
-
79
-
80
-
81
-
82
-
83
-
84
-
85
-
86
-
87
-
88
-
89
-
90
-
91
-
92
-
93
-
94
-
95
-
96
-
97
-
98
-
99
-
100
-
101
-
102
-
103
-
104
-
105
-
106
-
107
-
108
-
109
-
110
-
111
-
112
-
113
-
114
-
115
-
116
-
117
-
118
-
119
-
120
-
121
-
122
-
123
-
124
-
125
-
126
-
127
-
128
-
129
-
130
-
131
-
132
-
133
-
134
-
135
-
136
-
137
-
138
-
139
-
140
-
141
-
142
-
143
-
144
-
145
-
146
-
147
-
148
-
149
-
150
-
151
-
152
-
153
-
154
-
155
-
156
-
157
-
158
-
159
-
160
-
161
-
162
-
163
-
164
-
165
-
166
-
167
-
168
-
169
-
170
-
171
-
172
-
173
-
174
-
175
-
176
-
177
-
178
-
179
-
180
-
181
-
182
-
183
-
184
-
185
-
186
-
187
-
188
-
189
-
190
-
191
-
192
-
193
-
194
-
195
-
196
-
197
-
198
-
199
-
200
-
201
-
202
-
203
-
204
-
205
-
206
-
207
-
208
-
209
 |
 |

34 Report on Operations Analysis of the Financial Position and Operating Results
of the Fiat Group and Fiat S.p.A
FINANCIAL POSITION AND OPERATING PERFORMANCE
OF FIAT S.P.A.
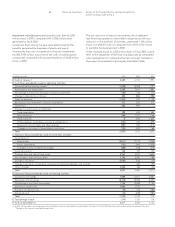
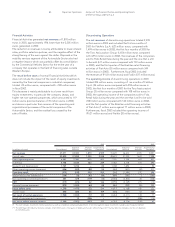
Statement of Operations
The net loss of the Parent Company for the fiscal year as resulting
from the Statement of Operations was 2,359 million euros,
compared with a net loss of 2,053 million euros in fiscal 2002.
The following table contains a breakdown of this result:
(in millions of euros) 2003 2002
Investment income 400 278
Adjustments (2,379) (2,866)
Net financial expenses (169) (26)
Cost of personnel and services, less revenues (130) (126)
Non-operating income (expenses) (20) 632
Income taxes (61)55
Net result (2,359) (2,053)
Net investment income totaled 400 million euros. It consists of
dividends, including the respective tax credits, paid by subsidiaries
and associated companies.
A breakdown of the dividends received in 2003 and 2002 is
provided in the Notes to the Financial Statements of Fiat S.p.A.
Adjustments totaled 2,379 million euros in 2003 and principally
reflect the writedowns in the book value of the subsidiaries Fiat
Partecipazioni S.p.A. (formerly Sicind S.p.A.) due to the negative
performance of the Automobile Sector (1,210 million euros), Fiat
Netherlands Holding N.V. due to losses at the subsidiaries Iveco
and CNH (1,000 million euros), and Magneti Marelli Holding S.p.A.
(144 million euros).
In 2002, the adjustments were mainly accounted for by Fiat
Partecipazioni S.p.A. (1,189 million euros), Fiat Netherlands
Holding N.V. (732 million euros), Comau B.V. (350 million euros),
Sicind S.p.A. (291 million euros), and Iveco N.V. (280 million euros).
Net financial expenses totaled 169 million euros, against 26
million euros in 2002, representing an increase of 143 million
euros, mainly due to the increase in average indebtedness
caused by investments in equity interests.
The cost of personnel and services, less revenues, totaled 130
million euros (126 million euros in 2002). In particular, the cost
of personnel and services totaled 243 million euros, compared
with 221 million euros in 2002. The 22-million-euro increase stems
mainly from higher costs related to personnel who left the
Company. The average number of employees was 167 (including
15 seconded to the principal companies of the Group),
compared with 210 employees in 2002 (including 16 seconded
employees). Revenues totaled 113 million euros, or an increase
of 18 million euros over the previous fiscal year. They included
royalties from the right to use the Fiat trademark, computed as
a percentage of the sales of the individual Group companies,
and fees for services rendered by management personnel.
Net non-operating expenses totaled 20 million euros and
largely comprised commissions paid to Mediobanca for the
postponement of the commitments undertaken by Mediobanca
itself in the framework of the Ferrari contract mentioned in Note
14 of the Financial Statements of Fiat S.p.A. (16 million euros).
In 2002, net non-operating income was represented for 630
million euros by the net gain realized on the sale of 34% of
Ferrari S.p.A. to Mediobanca S.p.A.
Income taxes totaled 61 million euros, resulting from cancellation
of the net deferred tax assets set aside in previous years, as
there is no reasonable certainty that they will be recovered
in subsequent fiscal years.
For the same reason, tax prepayments on the tax loss for
the fiscal year were not counted.
Income taxes in 2002 were represented by 55 million euros
in prepaid income taxes to be recovered.
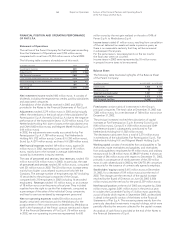
Balance Sheet
The following table illustrates highlights of the Balance Sheet
of the Parent Company:
(in millions of euros) At 12/31/2003 At 12/31/2002
Fixed assets 7,404 8,144
Working capital 77 (169)
Total net invested capital 7,481 7,975
Stockholders’ equity 5,415 5,934
Net Financial Position (2,066) (2,041)
Fixed assets consist mainly of investments in the Group’s
principal companies. The total value at December 31, 2003 was
7,282 million euros, for a net decrease of 768 million euros since
December 31, 2002.
The principal increases involved the subscription of capital
increases at Fiat Partecipazioni S.p.A. (formerly Sicind S.p.A.)
(100 million euros), Comau B.V. (100 million euros) and CNH
(“preference shares”) subsequently contributed to Fiat
Netherlands Holding N.V. (1,382 million euros).
The decreases mainly stem from a total of 2,374 million euros
in writedowns of the subsidiaries Fiat Partecipazioni S.p.A., Fiat
Netherlands Holding N.V. and Magneti Marelli Holding S.p.A.
Working capital consists of receivables from and payables to Tax
Authorities, trade receivables and payables, and receivables
from and payables to employees for 49 million euros, and ordinary
treasury stock for 28 million euros (4,384,019 shares). It shows an
increase of 246 million euros with respect to December 31, 2002,
primarily in consequence of reimbursement of the 250 million
euros in cash collateral paid in 2002 by the CAV.TO.MI. consortium
as security for the issuance of contractually agreed suretyships.
Stockholders’ equity totaled 5,415 million euros at December
31, 2003, for a decrease of 519 million euros since the end of
2002. The changes are the net result of the capital increase
resolved by the Board of Directors on June 26, 2003 (1,836
million euros) and the net loss for the year (2,359 million euros).
Net financial position at the end of 2003 was negative by 2,066
million euros, against 2,041 million euros in the previous year.
It includes the Convertible Facility of 3 billion euros granted by
a pool of banks which expires in September 2005, as described
in detail in the specific section of the Notes to the Financial
Statements of Fiat S.p.A. The worsening stems mainly from the
previously described investments in equity holdings, which were
partially offset by the amounts collected for the capital increase.
An analysis of cash flows is provided at the end of the Notes to
the Financial Statements of S.p.A.