Chrysler 2003 Annual Report Download - page 72
Download and view the complete annual report
Please find page 72 of the 2003 Chrysler annual report below. You can navigate through the pages in the report by either clicking on the pages listed below, or by using the keyword search tool below to find specific information within the annual report.-
 1
1 -
2
-
3
-
4
-
5
-
6
-
7
-
8
-
9
-
10
-
11
-
12
-
13
-
14
-
15
-
16
-
17
-
18
-
19
-
20
-
21
-
22
-
23
-
24
-
25
-
26
-
27
-
28
-
29
-
30
-
31
-
32
-
33
-
34
-
35
-
36
-
37
-
38
-
39
-
40
-
41
-
42
-
43
-
44
-
45
-
46
-
47
-
48
-
49
-
50
-
51
-
52
-
53
-
54
-
55
-
56
-
57
-
58
-
59
-
60
-
61
-
 62
62 -
 63
63 -
 64
64 -
 65
65 -
 66
66 -
 67
67 -
 68
68 -
 69
69 -
 70
70 -
 71
71 -
 72
72 -
 73
73 -
 74
74 -
 75
75 -
 76
76 -
 77
77 -
 78
78 -
 79
79 -
 80
80 -
 81
81 -
 82
82 -
83
-
84
-
85
-
86
-
87
-
88
-
89
-
90
-
91
-
92
-
93
-
94
-
95
-
96
-
97
-
98
-
99
-
100
-
101
-
102
-
103
-
104
-
105
-
106
-
107
-
108
-
109
-
110
-
111
-
112
-
113
-
114
-
115
-
116
-
117
-
118
-
119
-
120
-
121
-
122
-
123
-
124
-
125
-
126
-
127
-
128
-
129
-
130
-
131
-
132
-
133
-
134
-
135
-
136
-
137
-
138
-
139
-
140
-
141
-
142
-
143
-
144
-
145
-
146
-
147
-
148
-
149
-
150
-
151
-
152
-
153
-
154
-
155
-
156
-
157
-
158
-
159
-
160
-
161
-
162
-
163
-
164
-
165
-
166
-
167
-
168
-
169
-
170
-
171
-
172
-
173
-
174
-
175
-
176
-
177
-
178
-
179
-
180
-
181
-
182
-
183
-
184
-
185
-
186
-
187
-
188
-
189
-
190
-
191
-
192
-
193
-
194
-
195
-
196
-
197
-
198
-
199
-
200
-
201
-
202
-
203
-
204
-
205
-
206
-
207
-
208
-
209
 |
 |

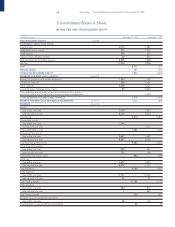
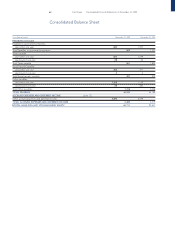
71 Fiat Group Consolidated Financial Statements at December 31, 2003
Consolidated Statement of Operations
(in millions of euros) 2003 2002 2001
VALUE OF PRODUCTION (note 15)
Revenues from sales and services 48,346 55,427 57,575
Change in work in progress, semifinished
and finished products inventories 700 (816) 7
Change in contract work in progress (1,075) 222 431
Additions to internally produced fixed assets 688 1,107 1,069
Other income and revenues:
revenue grants 52 47 79
other 1,637 2,105 2,166
Total Other income and revenues 1,689 2,152 2,245
TOTAL VALUE OF PRODUCTION 50,348 58,092 61,327
COSTS OF PRODUCTION (note 16)
Raw materials, supplies and merchandise 28,392 30,289 31,255
Services 8,505 9,890 9,835
Leases and rentals 367 468 487
Personnel:
salaries and wages 4,707 5,457 5,862
social security contributions 1,249 1,365 1,551
employee severance indemnities 244 256 315
employee pensions and similar obligations 185 100 122
other costs 303 376 319
Total Personnel costs 6,688 7,554 8,169
Amortization, depreciation and writedowns:
amortization of intangible fixed assets 519 595 593
depreciation of property, plant and equipment 1,750 2,019 2,287
writedown of fixed assets 35 38
writedown of receivables among
current assets and cash 278 366 538
Total Amortization, depreciation and writedowns 2,582 2,983 3,426
Change in raw materials, supplies
and merchandise inventories 81 38 (110)
Provisions for risks 1,163 1,138 1,038
Other provisions 17 30 6
Other operating costs 1,028 1,304 1,309
Expenses of financial services companies 668 1,115 904
Insurance claims and other insurance costs 1,367 4,045 4,690
TOTAL COSTS OF PRODUCTION 50,858 58,854 61,009
DIFFERENCE BETWEEN THE
VALUE AND COSTS OF PRODUCTION (510) (762) 318
FINANCIAL INCOME AND EXPENSES (note 17)
Investment income from:
unconsolidated subsidiaries –479
associated companies 111
other companies 21 151 184
Total Investment income 22 156 264
Other financial income:
from receivables held as fixed assets:
from others 322
from securities held as fixed assets
other than equity investments –156 253
from securities held as current assets
other than equity investments 119 147 301