Chrysler 2003 Annual Report Download - page 12
Download and view the complete annual report
Please find page 12 of the 2003 Chrysler annual report below. You can navigate through the pages in the report by either clicking on the pages listed below, or by using the keyword search tool below to find specific information within the annual report.-
 1
1 -
 2
2 -
 3
3 -
 4
4 -
 5
5 -
 6
6 -
 7
7 -
 8
8 -
 9
9 -
 10
10 -
 11
11 -
 12
12 -
 13
13 -
 14
14 -
 15
15 -
 16
16 -
 17
17 -
 18
18 -
 19
19 -
 20
20 -
 21
21 -
 22
22 -
23
-
24
-
25
-
26
-
27
-
28
-
29
-
30
-
31
-
32
-
33
-
34
-
35
-
36
-
37
-
38
-
39
-
40
-
41
-
42
-
43
-
44
-
45
-
46
-
47
-
48
-
49
-
50
-
51
-
52
-
53
-
54
-
55
-
56
-
57
-
58
-
59
-
60
-
61
-
62
-
63
-
64
-
65
-
66
-
67
-
68
-
69
-
70
-
71
-
72
-
73
-
74
-
75
-
76
-
77
-
78
-
79
-
80
-
81
-
82
-
83
-
84
-
85
-
86
-
87
-
88
-
89
-
90
-
91
-
92
-
93
-
94
-
95
-
96
-
97
-
98
-
99
-
100
-
101
-
102
-
103
-
104
-
105
-
106
-
107
-
108
-
109
-
110
-
111
-
112
-
113
-
114
-
115
-
116
-
117
-
118
-
119
-
120
-
121
-
122
-
123
-
124
-
125
-
126
-
127
-
128
-
129
-
130
-
131
-
132
-
133
-
134
-
135
-
136
-
137
-
138
-
139
-
140
-
141
-
142
-
143
-
144
-
145
-
146
-
147
-
148
-
149
-
150
-
151
-
152
-
153
-
154
-
155
-
156
-
157
-
158
-
159
-
160
-
161
-
162
-
163
-
164
-
165
-
166
-
167
-
168
-
169
-
170
-
171
-
172
-
173
-
174
-
175
-
176
-
177
-
178
-
179
-
180
-
181
-
182
-
183
-
184
-
185
-
186
-
187
-
188
-
189
-
190
-
191
-
192
-
193
-
194
-
195
-
196
-
197
-
198
-
199
-
200
-
201
-
202
-
203
-
204
-
205
-
206
-
207
-
208
-
209
 |
 |

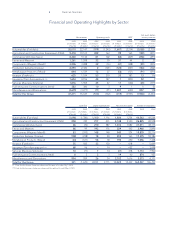
11 Report on Operations
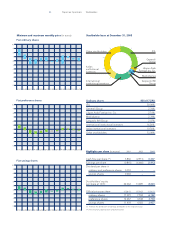
Ordinary shares 800,417,598
IFIL 30.06%
Generali Group 2.76%
Libyan Arab Foreign Inv. Co. 2.70%
Mediobanca 2.39%
Sanpaolo IMI Group 2.07%
International institutional investors 16.26%
Italian institutional investors 10.76%
Other stockholders 33.00%
Highlights per share (in euros) 2001 2002 2003
Cash flow per share (**) 3.856 (2.911) 0.407
Earnings per share (0.841) (6.660) (2.412)
Dividend per share (*)
ordinary and preference shares 0.310 – –
savings shares 0.465 – –
Stockholders’ equity
per share at 12/31 22.462 13.489 8.623
Official price per share 12.28.01 12.30.02 12.30.03
ordinary shares 17.921 7.704 6.142
preference shares 12.267 4.348 3.704
savings shares 11.459 4.183 3.957
(*) Reflects the distribution of earnings attributable to the respective year.
(**) Net result plus depreciation and amortization.
Italian
institutional
investors
Other stockholders
Generali
Group
Libyan Arab
Foreign Inv. Co.
Mediobanca
Sanpaolo IMI
Group
IFIL
International
institutional investors
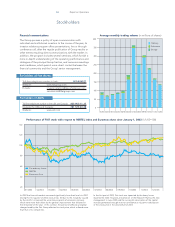
Stockholders
Minimum and maximum monthly price (in euros)
Fiat savings shares
01/03 02/03 03/03 04/03 05/03 06/03 07/03 08/03 09/03 10/03 11/03 12/03
10
8
6
4
2
0
9
7
5
3
1
01/03 02/03 03/03 04/03 05/03 06/03 07/03 08/03 09/03 10/03 11/03 12/03
01/03 02/03 03/03 04/03 05/03 06/03 07/03 08/03 09/03 10/03 11/03 12/03
10
8
6
4
2
0
9
7
5
3
1
Fiat ordinary shares
Fiat preference shares
10
8
6
4
2
0
9
7
5
3
1
Stockholder base at December 31, 2003