Chrysler 2003 Annual Report Download - page 73
Download and view the complete annual report
Please find page 73 of the 2003 Chrysler annual report below. You can navigate through the pages in the report by either clicking on the pages listed below, or by using the keyword search tool below to find specific information within the annual report.-
 1
1 -
2
-
3
-
4
-
5
-
6
-
7
-
8
-
9
-
10
-
11
-
12
-
13
-
14
-
15
-
16
-
17
-
18
-
19
-
20
-
21
-
22
-
23
-
24
-
25
-
26
-
27
-
28
-
29
-
30
-
31
-
32
-
33
-
34
-
35
-
36
-
37
-
38
-
39
-
40
-
41
-
42
-
43
-
44
-
45
-
46
-
47
-
48
-
49
-
50
-
51
-
52
-
53
-
54
-
55
-
56
-
57
-
58
-
59
-
60
-
61
-
62
-
 63
63 -
 64
64 -
 65
65 -
 66
66 -
 67
67 -
 68
68 -
 69
69 -
 70
70 -
 71
71 -
 72
72 -
 73
73 -
 74
74 -
 75
75 -
 76
76 -
 77
77 -
 78
78 -
 79
79 -
 80
80 -
 81
81 -
 82
82 -
 83
83 -
84
-
85
-
86
-
87
-
88
-
89
-
90
-
91
-
92
-
93
-
94
-
95
-
96
-
97
-
98
-
99
-
100
-
101
-
102
-
103
-
104
-
105
-
106
-
107
-
108
-
109
-
110
-
111
-
112
-
113
-
114
-
115
-
116
-
117
-
118
-
119
-
120
-
121
-
122
-
123
-
124
-
125
-
126
-
127
-
128
-
129
-
130
-
131
-
132
-
133
-
134
-
135
-
136
-
137
-
138
-
139
-
140
-
141
-
142
-
143
-
144
-
145
-
146
-
147
-
148
-
149
-
150
-
151
-
152
-
153
-
154
-
155
-
156
-
157
-
158
-
159
-
160
-
161
-
162
-
163
-
164
-
165
-
166
-
167
-
168
-
169
-
170
-
171
-
172
-
173
-
174
-
175
-
176
-
177
-
178
-
179
-
180
-
181
-
182
-
183
-
184
-
185
-
186
-
187
-
188
-
189
-
190
-
191
-
192
-
193
-
194
-
195
-
196
-
197
-
198
-
199
-
200
-
201
-
202
-
203
-
204
-
205
-
206
-
207
-
208
-
209
 |
 |

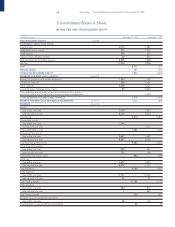
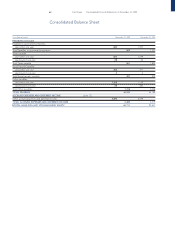
72 Fiat Group Consolidated Financial Statements at December 31, 2003
Consolidated Statement of Operations
(in millions of euros) 2003 2002 2001
FINANCIAL INCOME AND EXPENSES (continued)
Other financial income (continued)
Other income from:
unconsolidated subsidiaries 825 11
associated companies 723 22
others 1,367 1,866 1,599
Total Other income 1,382 1,914 1,632
Total Other financial income 1,504 2,219 2,188
Interest and other financial expenses from:
unconsolidated subsidiaries 323
associated companies 6210
others 2,480 3,042 3,119
Total Interest and other financial expenses 2,489 3,046 3,132
TOTAL FINANCIAL INCOME AND EXPENSES (963) (671) (680)
ADJUSTMENTS TO FINANCIAL ASSETS (note 18)
Revaluations of:
equity investments 91 68 204
financial fixed assets other than equity investments ––38
securities held in current assets other
than equity investments 14 712
Total Revaluations 105 75 254
Writedowns of:
equity investments 263 809 577
financial fixed assets other than equity
investments 184 128
securities held in current assets other
than equity investments 845 28
financial receivables 518 15
Total Writedowns 277 956 748
TOTAL ADJUSTMENTS TO FINANCIAL ASSETS (172) (881) (494)
EXTRAORDINARY INCOME AND EXPENSES (note 19)
Income:
gains on disposals 1,826 1,081 1,515
other income 191 154 130
Total Income 2,017 1,235 1,645
Expenses:
losses on disposals 50 1,239 56
taxes relating to prior years 26 79 18
other expenses 1,594 2,420 1,212
Total Expenses 1,670 3,738 1,286
TOTAL EXTRAORDINARY INCOME AND EXPENSES 347 (2,503) 359
LOSS BEFORE TAXES (1,298) (4,817) (497)
Income taxes (note 20) 650 (554) 294
LOSS BEFORE MINORITY INTEREST (1,948) (4,263) (791)
Minority interest 48 315 346
NET LOSS (1,900) (3,948) (445)