Chrysler 2003 Annual Report Download - page 27
Download and view the complete annual report
Please find page 27 of the 2003 Chrysler annual report below. You can navigate through the pages in the report by either clicking on the pages listed below, or by using the keyword search tool below to find specific information within the annual report.-
 1
1 -
2
-
3
-
4
-
5
-
6
-
7
-
8
-
9
-
10
-
11
-
12
-
13
-
14
-
15
-
16
-
 17
17 -
 18
18 -
 19
19 -
 20
20 -
 21
21 -
 22
22 -
 23
23 -
 24
24 -
 25
25 -
 26
26 -
 27
27 -
 28
28 -
 29
29 -
 30
30 -
 31
31 -
 32
32 -
 33
33 -
 34
34 -
 35
35 -
 36
36 -
 37
37 -
38
-
39
-
40
-
41
-
42
-
43
-
44
-
45
-
46
-
47
-
48
-
49
-
50
-
51
-
52
-
53
-
54
-
55
-
56
-
57
-
58
-
59
-
60
-
61
-
62
-
63
-
64
-
65
-
66
-
67
-
68
-
69
-
70
-
71
-
72
-
73
-
74
-
75
-
76
-
77
-
78
-
79
-
80
-
81
-
82
-
83
-
84
-
85
-
86
-
87
-
88
-
89
-
90
-
91
-
92
-
93
-
94
-
95
-
96
-
97
-
98
-
99
-
100
-
101
-
102
-
103
-
104
-
105
-
106
-
107
-
108
-
109
-
110
-
111
-
112
-
113
-
114
-
115
-
116
-
117
-
118
-
119
-
120
-
121
-
122
-
123
-
124
-
125
-
126
-
127
-
128
-
129
-
130
-
131
-
132
-
133
-
134
-
135
-
136
-
137
-
138
-
139
-
140
-
141
-
142
-
143
-
144
-
145
-
146
-
147
-
148
-
149
-
150
-
151
-
152
-
153
-
154
-
155
-
156
-
157
-
158
-
159
-
160
-
161
-
162
-
163
-
164
-
165
-
166
-
167
-
168
-
169
-
170
-
171
-
172
-
173
-
174
-
175
-
176
-
177
-
178
-
179
-
180
-
181
-
182
-
183
-
184
-
185
-
186
-
187
-
188
-
189
-
190
-
191
-
192
-
193
-
194
-
195
-
196
-
197
-
198
-
199
-
200
-
201
-
202
-
203
-
204
-
205
-
206
-
207
-
208
-
209
 |
 |

26 Report on Operations Analysis of the Financial Position and Operating Results
of the Fiat Group and Fiat S.p.A
Intangible Fixed Assets
Intangible fixed assets (start-up and expansion costs, goodwill,
construction in progress and others) amount to 3,724 million
euros, 1,476 million euros less than the 5,200 million euros
reported at the end of 2002. Over half of the decrease is
attributable to the disposals of activities carried out during
2003, as well as to the reduction in value of goodwill due to
changes in foreign exchange rates.
The investments made during the fiscal year, for a total of
527 million euros (603 million euros in 2002), were almost totally
offset by amortization for the period, which totaled 519 million
euros (595 million euros in 2002).
Property, Plant and Equipment
Property, plant and equipment totaled 9,675 million euros
(12,106 million euros at December 31, 2002). The decrease
(-2,431 million euros) largely reflects the changes in the scope
of consolidation (sale of Fraikin, FiatAvio S.p.A., and the Toro
Assicurazioni Group), variations in foreign exchange rates and
writedowns during the year.
Overall investments in fixed assets totaled 2,011 million euros
(2,771 million euros in 2002), including those in long-term leases
which declined by 486 million euros, from 844 million euros in
2002 to 358 million euros in 2003. This reduction is mainly
attributable to the disposal of Fraikin, while investments net
of long term leases were impacted by the deconsolidation of
FiatAvio S.p.A., the Toro Assicurazioni Group, and the Teksid
Aluminum Business Unit.
In 2003 depreciation of property, plant and equipment totaled
1,750 million euros (2,019 million euros in 2002).
At December 31, 2003, accumulated depreciation and
writedowns totaled 17,366 million euros, corresponding to
64% of gross fixed assets, compared with approximately 60%
at the end of 2002.
Financial Fixed Assets
Financial fixed assets totaled 3,950 million euros, compared
with 6,638 million euros at December 31, 2002. The significant
reduction of 2,688 million euros is mainly due to the effect of the
deconsolidation of the Toro Assicurazioni Group, which was only
partially offset by the increase mainly stemming from the equity
investments in Fidis Retail Italia (49% held by the Automobile
Sector following the sale of 51% of the stake) and Naveco (which
was consolidated according to the proportional method until
2002).
Financial Assets not held as Fixed Assets
Financial assets not held as fixed assets totaled 120 million
euros, 5,974 million euros less than the 6,094 million euros at the
end of 2002, following disposal of the Toro Assicurazioni Group
and consequent deconsolidation of its activities.
Net Deferred Tax Assets
Net deferred tax assets (deferred tax assets net of deferred
tax reserve) totaled 1,668 million euros at December 31, 2003,
compared with 2,263 million euros at the end of 2002. The
decrease with respect to 2002 amounted to 595 million euros,
mainly attributable to the utilization of tax prepayments whose
recovery was primarily connected to the realization of capital
gains on the disposal of equity investments, which occurred
in 2003.
Working Capital
The Group’s working capital increased by 639 million euros
to a negative 2,134 million euros, up from the negative 2,773
million euros reported at the end of 2002. On a comparable
basis the increase would have been 872 million euros.
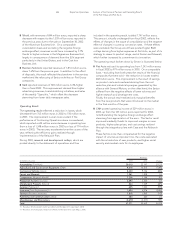
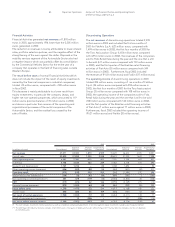
The following table illustrates the composition of working
capital in the two fiscal years:
(in millions of euros) At 12.31.2003 At 12.31.2002 Change
Net inventories 6,912 7,050 (138)
Trade receivables 4,553 5,784 (1,231)
Trade payables (12,588) (13,267) 679
Other receivables / (payables) (1,011) (2,340) 1,329
Working capital (2,134) (2,773) 639
An analysis of the changes affecting the main components
of working capital is provided below.
Net inventories (raw materials, finished products, and work
in progress), net of advances received for contract work in
progress, totaled 6,912 million euros, against 7,050 million euros
at December 31, 2002. The decrease is mainly attributable to
changes in the scope of consolidation during the fiscal year
(principally the sale of FiatAvio S.p.A.). On a comparable basis,
inventories were 389 million euros higher due to the increase in
Fiat Auto stock connected with the introduction of new models.
Trade receivables totaled 4,553 million euros, 1,231 million
euros less than the 5,784 million euros reported at the end of
2002. The change in the scope of consolidation entailed a
reduction of 1,106 million euros.
Trade payables totaled 12,588 million euros compared with the
13,267 million euros at December 31, 2002. The decrease of 679
million euros is entirely attributable to changes in the scope of
consolidation.
The negative balance of other receivables/(payables), which
also includes trade accruals and deferrals, improved from -2,340
million euros at December 31, 2002 to -1,011 million euros. The
lower negative balance by 1,329 million euros includes 715
million euros stemming from changes in the scope of
consolidation.