Chrysler 2003 Annual Report Download - page 34
Download and view the complete annual report
Please find page 34 of the 2003 Chrysler annual report below. You can navigate through the pages in the report by either clicking on the pages listed below, or by using the keyword search tool below to find specific information within the annual report.-
 1
1 -
2
-
3
-
4
-
5
-
6
-
7
-
8
-
9
-
10
-
11
-
12
-
13
-
14
-
15
-
16
-
17
-
18
-
19
-
20
-
21
-
22
-
23
-
 24
24 -
 25
25 -
 26
26 -
 27
27 -
 28
28 -
 29
29 -
 30
30 -
 31
31 -
 32
32 -
 33
33 -
 34
34 -
 35
35 -
 36
36 -
 37
37 -
 38
38 -
 39
39 -
 40
40 -
 41
41 -
 42
42 -
 43
43 -
 44
44 -
45
-
46
-
47
-
48
-
49
-
50
-
51
-
52
-
53
-
54
-
55
-
56
-
57
-
58
-
59
-
60
-
61
-
62
-
63
-
64
-
65
-
66
-
67
-
68
-
69
-
70
-
71
-
72
-
73
-
74
-
75
-
76
-
77
-
78
-
79
-
80
-
81
-
82
-
83
-
84
-
85
-
86
-
87
-
88
-
89
-
90
-
91
-
92
-
93
-
94
-
95
-
96
-
97
-
98
-
99
-
100
-
101
-
102
-
103
-
104
-
105
-
106
-
107
-
108
-
109
-
110
-
111
-
112
-
113
-
114
-
115
-
116
-
117
-
118
-
119
-
120
-
121
-
122
-
123
-
124
-
125
-
126
-
127
-
128
-
129
-
130
-
131
-
132
-
133
-
134
-
135
-
136
-
137
-
138
-
139
-
140
-
141
-
142
-
143
-
144
-
145
-
146
-
147
-
148
-
149
-
150
-
151
-
152
-
153
-
154
-
155
-
156
-
157
-
158
-
159
-
160
-
161
-
162
-
163
-
164
-
165
-
166
-
167
-
168
-
169
-
170
-
171
-
172
-
173
-
174
-
175
-
176
-
177
-
178
-
179
-
180
-
181
-
182
-
183
-
184
-
185
-
186
-
187
-
188
-
189
-
190
-
191
-
192
-
193
-
194
-
195
-
196
-
197
-
198
-
199
-
200
-
201
-
202
-
203
-
204
-
205
-
206
-
207
-
208
-
209
 |
 |

33 Report on Operations Analysis of the Financial Position and Operating Results
of the Fiat Group and Fiat S.p.A
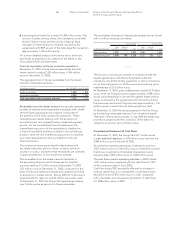
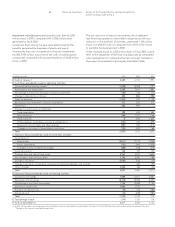
Cash and cash equivalents collected by the centralized cash
management during its activity have been recorded in the item
Financial payables net of intersegment activities in the Industrial
Activities column. However, funds that were transferred to other
Activities, and in particular Financial Activities, were posted net
of the relative intersegment relationships, as shown in the table
below.
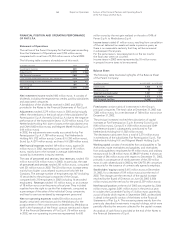
During 2003, the Group strengthened its financial structure
by reducing net indebtedness (financial payables net of
intersegment activities, cash and marketable securities)
from 24,594 million euros to 15,542 million euros.
Cash and marketable securities increased by a total of 2,004
million euros. At December 31, 2002 the balance included
cash and marketable securities of companies that have been
sold (the Toro Assicurazioni Group in particular). If cash
and marketable securities of Industrial Activities alone are
considered (as stated previously, Industrial Activities include
companies that operate centralized cash management activities
for the Group), the increase amounted to 3,659 million euros
(from 3,132 million euros at December 31, 2002 to 6,791
million euros at December 31, 2003).
When the changes in the Group’s financial structure over
the year are analyzed, it must be remembered that:
❚deconsolidation of the sold companies (Discontinuing
Operations) caused a reduction in net indebtedness of
approximately 4.4 billion euros with respect to December
31, 2002;
❚Industrial Activities show a net indebtedness of
approximately 5.1 billion euros, down from the 7.4 billion
euros in the previous year in consequence of the proceeds
from disposals and the capital increase at Fiat S.p.A., net
of operating requirements during the period;
❚Financial Activities show a reduction in the financed portfolio
and corresponding indebtedness. This reduction is partially
due to the effects of conversion of the portfolios denominated
in currencies other than the euro and partially reflects an
actual reduction in the outstanding balance of financing,
in consequence of lower levels of activity.
At 12.31.2003 At 12.31.2002
Industrial Financial Discontinuing Industrial Financial Discontinuing
(in millions of euros) Consolidated Activities Activities Operations Consolidated Activities Activities Operations
Financial payables net of intersegment activities (22,034)(11,531)(9,909)(594) (28,923) (10,050) (12,630) (6,243)
Accrued financial expenses (593)(416)(171)(6) (785) (555) (108) (122)
Prepaid financial expenses 85 68 17 – 118 63 19 36
Cash 3,211 3,121 77 13 3,489 2,746 153 590
Securities 3,789 3,670 119 – 1,507 386 338 783
Net Indebtedness (15,542)(5,088)(9,867)(587) (24,594) (7,410) (12,228) (4,956)
Financial receivables and lease contracts receivable 12,576 2,114 9,715 747 21,406 2,502 10,942 7,962
Accrued financial income 301 298 3 – 543 351 32 160
Deferred financial income (363)(65)(195)(103) (1,135) (70) (211) (854)
Net Financial Position (3,028)(2,741)(344)57 (3,780) (4,627) (1,465) 2,312
At 12.31.2003 At 12.31.2002
Industrial Financial Discontinuing Industrial Financial Discontinuing
(in millions of euros) Consolidated Activities Activities Operations Consolidated Activities Activities Operations
Short-term financial payables to others 6,616 5,150 1,187 279 8,310 4,220 1,954 2,136
Long-term financial payables to others 15,418 14,480 634 304 20,613 17,378 1,216 2,019
(Intersegment financial receivables) –(8,459)(355)(5) – (12,547) (489) (514)
Intersegment financial payables – 360 8,443 16 – 999 9,949 2,602
Financial payables net of
intersegment activities 22,034 11,531 9,909 594 28,923 10,050 12,630 6,243
Breakdown of net indebtedness and net financial position by Activity Segment