Chrysler 2003 Annual Report Download - page 30
Download and view the complete annual report
Please find page 30 of the 2003 Chrysler annual report below. You can navigate through the pages in the report by either clicking on the pages listed below, or by using the keyword search tool below to find specific information within the annual report.-
 1
1 -
2
-
3
-
4
-
5
-
6
-
7
-
8
-
9
-
10
-
11
-
12
-
13
-
14
-
15
-
16
-
17
-
18
-
19
-
 20
20 -
 21
21 -
 22
22 -
 23
23 -
 24
24 -
 25
25 -
 26
26 -
 27
27 -
 28
28 -
 29
29 -
 30
30 -
 31
31 -
 32
32 -
 33
33 -
 34
34 -
 35
35 -
 36
36 -
 37
37 -
 38
38 -
 39
39 -
 40
40 -
41
-
42
-
43
-
44
-
45
-
46
-
47
-
48
-
49
-
50
-
51
-
52
-
53
-
54
-
55
-
56
-
57
-
58
-
59
-
60
-
61
-
62
-
63
-
64
-
65
-
66
-
67
-
68
-
69
-
70
-
71
-
72
-
73
-
74
-
75
-
76
-
77
-
78
-
79
-
80
-
81
-
82
-
83
-
84
-
85
-
86
-
87
-
88
-
89
-
90
-
91
-
92
-
93
-
94
-
95
-
96
-
97
-
98
-
99
-
100
-
101
-
102
-
103
-
104
-
105
-
106
-
107
-
108
-
109
-
110
-
111
-
112
-
113
-
114
-
115
-
116
-
117
-
118
-
119
-
120
-
121
-
122
-
123
-
124
-
125
-
126
-
127
-
128
-
129
-
130
-
131
-
132
-
133
-
134
-
135
-
136
-
137
-
138
-
139
-
140
-
141
-
142
-
143
-
144
-
145
-
146
-
147
-
148
-
149
-
150
-
151
-
152
-
153
-
154
-
155
-
156
-
157
-
158
-
159
-
160
-
161
-
162
-
163
-
164
-
165
-
166
-
167
-
168
-
169
-
170
-
171
-
172
-
173
-
174
-
175
-
176
-
177
-
178
-
179
-
180
-
181
-
182
-
183
-
184
-
185
-
186
-
187
-
188
-
189
-
190
-
191
-
192
-
193
-
194
-
195
-
196
-
197
-
198
-
199
-
200
-
201
-
202
-
203
-
204
-
205
-
206
-
207
-
208
-
209
 |
 |

29 Report on Operations Analysis of the Financial Position and Operating Results
of the Fiat Group and Fiat S.p.A
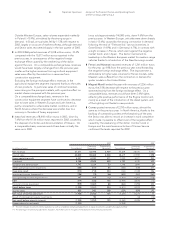
Investment activities generated positive cash flow of 2,897
million euros in 2003, compared with 2,096 million euros
generated in fiscal 2002.
Investment flows during the year were determined by the
benefits generated by disposals of assets and equity
investments that, net of acquisitions of equity investments,
totaled 3,955 million euros (net of the cash of sold/acquired
companies), compared with a positive balance of 2,668 million
euros in 2002.
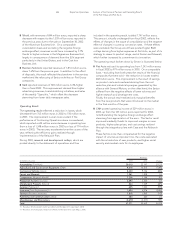
The net reduction in financial receivables, which reflected
less financings granted to associated companies as well as a
reduction in the portfolio of activities, generated 1,146 million
euros in available funds, as compared with 2,456 million euros
in available funds generated in 2002.
Other changes, equal to 3,226 million euros in fiscal 2003, mainly
refer to the repayment of the financing disbursed by centralized
cash management to companies that are no longer included in
the scope of consolidation (principally Fidis Retail Italia).
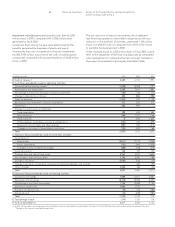
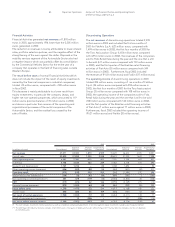
(in millions of euros) 2003 2002 2001
A)Cash at January 1 3,489 2,133 1,997
B)Cash flows provided by (used in) operating activities:
Net result before minority interest (1,948) (4,263) (791)
Amortization and depreciation 2,269 2,614 2,880
Net change in reserve for employee severance indemnities (136) (70) (77)
Change in deferred income taxes 422 (884) (588)
Gains on disposals (1,873) 124 (1,749)
Revaluations and writedowns of equity investments 177 525 372
Impairment 424 991 –
Change in current assets and liabilities:
Trade receivables 125 423 583
Net inventories (389) 1,325 (164)
Trade payables 6(104) 1,605
Other payables, receivables, accruals and deferrals (1) (614) 184 609
Reserve for income taxes and other reserves (287) 545 (413)
Changes in the scope of consolidation and others (123) (357) 168
Total (1,947) 1,053 2,435
C)Total cash flows provided by (used in) investment activities:
Investments in:
Fixed assets (2,011) (2,771) (3,438)
Equity investments (212) (563) (1,524)
Intangible assets and deferred charges (488) (518) (473)
Investment grants 134 90 100
Proceeds from the sale of fixed assets 4,167 3,231 2,652
Net change in financial receivables 1,146 2,456 (189)
Change in securities (3,065) (175) (15)
Change in securities of insurance companies net of policy liabilities and accruals –430 (97)
Other changes 3,226 (84) (33)
Total 2,897 2,096 (3,017)
D)Total cash flows provided by (used in) financing activities:
Increase in borrowings 1,989 12,047 8,561
Repayment of borrowings (6,178) (9,392) (6,057)
Net change in short-term borrowings 1,134 (5,358) (1,140)
Increase in capital stock 1,860 1,215 –
Purchase of treasury stock (18) (77) (266)
Dividends paid (15) (228) (380)
Total (1,228) (1,793) 718
E)Total change in cash (278) 1,356 136
F)Cash at December 31 3,211 3,489 2,133
(1) In 2002, this item does not include payment of the balance of assets and liabilities contributed by Fiat Auto to the Fiat-GM Powertrain joint venture, which was posted at the item
“Changes in the scope of consolidation and others.”