Chrysler 2003 Annual Report Download - page 116
Download and view the complete annual report
Please find page 116 of the 2003 Chrysler annual report below. You can navigate through the pages in the report by either clicking on the pages listed below, or by using the keyword search tool below to find specific information within the annual report.-
 1
1 -
2
-
3
-
4
-
5
-
6
-
7
-
8
-
9
-
10
-
11
-
12
-
13
-
14
-
15
-
16
-
17
-
18
-
19
-
20
-
21
-
22
-
23
-
24
-
25
-
26
-
27
-
28
-
29
-
30
-
31
-
32
-
33
-
34
-
35
-
36
-
37
-
38
-
39
-
40
-
41
-
42
-
43
-
44
-
45
-
46
-
47
-
48
-
49
-
50
-
51
-
52
-
53
-
54
-
55
-
56
-
57
-
58
-
59
-
60
-
61
-
62
-
63
-
64
-
65
-
66
-
67
-
68
-
69
-
70
-
71
-
72
-
73
-
74
-
75
-
76
-
77
-
78
-
79
-
80
-
81
-
82
-
83
-
84
-
85
-
86
-
87
-
88
-
89
-
90
-
91
-
92
-
93
-
94
-
95
-
96
-
97
-
98
-
99
-
100
-
101
-
102
-
103
-
104
-
105
-
 106
106 -
 107
107 -
 108
108 -
 109
109 -
 110
110 -
 111
111 -
 112
112 -
 113
113 -
 114
114 -
 115
115 -
 116
116 -
 117
117 -
 118
118 -
 119
119 -
 120
120 -
 121
121 -
 122
122 -
 123
123 -
 124
124 -
 125
125 -
 126
126 -
127
-
128
-
129
-
130
-
131
-
132
-
133
-
134
-
135
-
136
-
137
-
138
-
139
-
140
-
141
-
142
-
143
-
144
-
145
-
146
-
147
-
148
-
149
-
150
-
151
-
152
-
153
-
154
-
155
-
156
-
157
-
158
-
159
-
160
-
161
-
162
-
163
-
164
-
165
-
166
-
167
-
168
-
169
-
170
-
171
-
172
-
173
-
174
-
175
-
176
-
177
-
178
-
179
-
180
-
181
-
182
-
183
-
184
-
185
-
186
-
187
-
188
-
189
-
190
-
191
-
192
-
193
-
194
-
195
-
196
-
197
-
198
-
199
-
200
-
201
-
202
-
203
-
204
-
205
-
206
-
207
-
208
-
209
 |
 |

115 Fiat Group Consolidated Financial Statements at December 31, 2003
Notes to the Consolidated Financial Statements
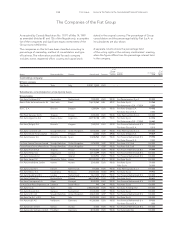
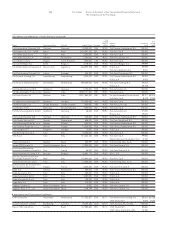
Net Sales and Revenues, Operating income (loss), Depreciation and Amortization, Capital expenditures by segment
Net sales Revenues Operating Depreciation
Inter- Income and Capital Total
(in millions of euros) Third parties segment (*) Total (loss) Amortization expenditures Assets
2003
Automobiles 19,839 171 20,010 (979)962 1,100 20,908
Agricultural and Construction Equipment 9,410 8 9,418 229 450 217 12,928
Commercial Vehicles 8,206 234 8,440 81 304 210 9,108
Ferrari and Maserati 1,250 11 1,261 32 85 193 965
Components 2,087 1,119 3,206 32 173 148 2,418
Production Systems 1,756 537 2,293 2 56 18 4,125
Metallurgical Products 735 109 844 12 49 56 739
Aviation (**)625 – 625 53 41 33 –
Insurance (***)1,654 – 1,654 44 16 – –
Services 1,019 797 1,816 45 30 7 1,892
Publishing and communications 372 11 383 10 7 3 251
Other companies and eliminations (****)318 (2,997)(2,679)(71)96 26 9,377
Group total 47,271 – 47,271 (510) 2,269 2,011 62,711
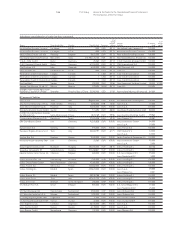
2002
Automobiles 21,908 239 22,147 (1,343) 959 1,116 30,026
Agricultural and Construction Equipment 10,502 11 10,513 163 541 431 14,434
Commercial Vehicles 8,816 320 9,136 102 424 587 10,846
Ferrari and Maserati 1,194 14 1,208 70 77 176 897
Components 2,085 1,203 3,288 (16) 190 148 2,752
Production Systems 1,763 557 2,320 (101) 64 20 4,763
Metallurgical Products 1,411 128 1,539 27 93 78 857
Aviation (**) 1,532 2 1,534 210 69 130 3,206
Insurance (***) 4,834 82 4,916 147 47 14 19,041
Services 1,005 960 1,965 67 42 14 3,306
Publishing and communications 346 14 360 3 8 3 227
Other companies and eliminations (****) 253 (3,530) (3,277) (91) 100 54 2,166
Group total 55,649 – 55,649 (762) 2,614 2,771 92,521
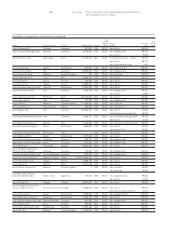
2001
Automobiles 24,177 263 24,440 (549) 1,150 1,331 33,488
Agricultural and Construction Equipment 10,762 15 10,777 209 553 615 18,228
Commercial Vehicles 8,120 530 8,650 271 410 718 10,005
Ferrari and Maserati 1,040 18 1,058 62 76 125 844
Components 2,438 1,635 4,073 (74) 207 240 3,551
Production Systems 1,510 708 2,218 60 63 38 5,537
Metallurgical Products 1,429 323 1,752 15 109 151 1,936
Aviation (**) 1,632 4 1,636 186 88 41 3,071
Insurance (***) 5,369 92 5,461 68 47 29 18,326
Services 762 1,043 1,805 73 70 32 3,253
Publishing and communications 334 13 347 (2) 7 6 234
Other companies and eliminations (****) 433 (4,644) (4,211) (1) 100 112 2,276
Group total 58,006 – 58,006 318 2,880 3,438 100,749
(*) Intersegment net sales and revenues include revenues between Group companies consolidated line-by-line and reporting to different Sectors. Intersegment sales are accounted for
at transfer prices that are substantially in line with market conditions.
(**) The Aviation Sector’s data is included up to the date of sale (July 1, 2003).
(***) The Insurance Sector’s data is included up to the date of sale (May 2, 2003).
(****) The operating income (loss) of “Other Companies” amounts to -137 million euros in 2003, -105 million euros in 2002 and -95 million euros in 2001.