Chrysler 2003 Annual Report Download - page 150
Download and view the complete annual report
Please find page 150 of the 2003 Chrysler annual report below. You can navigate through the pages in the report by either clicking on the pages listed below, or by using the keyword search tool below to find specific information within the annual report.-
 1
1 -
2
-
3
-
4
-
5
-
6
-
7
-
8
-
9
-
10
-
11
-
12
-
13
-
14
-
15
-
16
-
17
-
18
-
19
-
20
-
21
-
22
-
23
-
24
-
25
-
26
-
27
-
28
-
29
-
30
-
31
-
32
-
33
-
34
-
35
-
36
-
37
-
38
-
39
-
40
-
41
-
42
-
43
-
44
-
45
-
46
-
47
-
48
-
49
-
50
-
51
-
52
-
53
-
54
-
55
-
56
-
57
-
58
-
59
-
60
-
61
-
62
-
63
-
64
-
65
-
66
-
67
-
68
-
69
-
70
-
71
-
72
-
73
-
74
-
75
-
76
-
77
-
78
-
79
-
80
-
81
-
82
-
83
-
84
-
85
-
86
-
87
-
88
-
89
-
90
-
91
-
92
-
93
-
94
-
95
-
96
-
97
-
98
-
99
-
100
-
101
-
102
-
103
-
104
-
105
-
106
-
107
-
108
-
109
-
110
-
111
-
112
-
113
-
114
-
115
-
116
-
117
-
118
-
119
-
120
-
121
-
122
-
123
-
124
-
125
-
126
-
127
-
128
-
129
-
130
-
131
-
132
-
133
-
134
-
135
-
136
-
137
-
138
-
139
-
 140
140 -
 141
141 -
 142
142 -
 143
143 -
 144
144 -
 145
145 -
 146
146 -
 147
147 -
 148
148 -
 149
149 -
 150
150 -
 151
151 -
 152
152 -
 153
153 -
 154
154 -
 155
155 -
 156
156 -
 157
157 -
 158
158 -
 159
159 -
 160
160 -
161
-
162
-
163
-
164
-
165
-
166
-
167
-
168
-
169
-
170
-
171
-
172
-
173
-
174
-
175
-
176
-
177
-
178
-
179
-
180
-
181
-
182
-
183
-
184
-
185
-
186
-
187
-
188
-
189
-
190
-
191
-
192
-
193
-
194
-
195
-
196
-
197
-
198
-
199
-
200
-
201
-
202
-
203
-
204
-
205
-
206
-
207
-
208
-
209
 |
 |

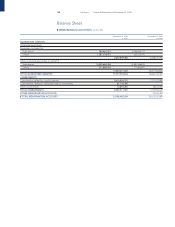
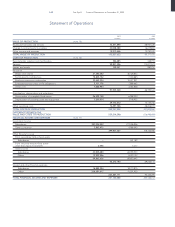
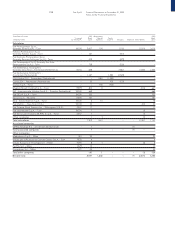
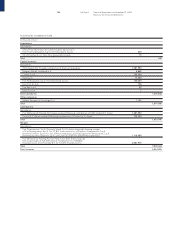
149 Fiat S.p.A. Financial Statements at December 31, 2003
Statement of Operations
2003 2002
in euros in euros
VALUE OF PRODUCTION (note 15)
Revenues from sales and services 73,271,898 68,927,335
Change in contract work in progress 20,038,288 16,219,800
Other income and revenues 19,217,446 10,230,420
TOTAL VALUE OF PRODUCTION 112,527,632 95,377,555
COSTS OF PRODUCTION (note 16)
Raw materials, supplies and merchandise 384,685 428,191
Services 99,821,396 115,877,073
Leases and rentals 735,001 982,252
Personnel
Wages and salaries 41,480,282 36,328,802
Social security contributions 12,845,132 7,333,885
Employee severance indemnities 30,443,304 10,077,951
Employee pensions and similar obligations 5,101,776 7,869,665
Other costs 7,664,954 4,584,858
97,535,448 66,195,161
Amortization, depreciation and writedowns
Amortization of intangible fixed assets 26,522,758 6,988,334
Depreciation of property, plant and equipment 3,250,914 3,146,922
29,773,672 10,135,256
Other operating costs 14,491,726 28,206,031
TOTAL COSTS OF PRODUCTION 242,741,928 221,823,964
DIFFERENCE BETWEEN THE
VALUE AND COSTS OF PRODUCTION (130,214,296) (126,446,409)
FINANCIAL INCOME AND EXPENSES (note 17)
Investment income
Subsidiaries 397,034,992 273,446,956
Other companies 2,892,475 4,989,540
399,927,467 278,436,496
Other financial income
From receivables held as fixed assets
Subsidiaries –441,189
From securities held as fixed assets
other than equity investments 2,556 3,277
Other income
Subsidiaries 40,543,680 60,390,523
Others 13,923,956 8,220,122
54,467,636 68,610,645
54,470,192 69,055,111
Interest and other financial expenses
Subsidiaries 16,885,354 18,773,875
Others 206,381,817 75,551,420
223,267,171 94,325,295
TOTAL FINANCIAL INCOME AND EXPENSES 231,130,488 253,166,312