Chrysler 2003 Annual Report Download - page 26
Download and view the complete annual report
Please find page 26 of the 2003 Chrysler annual report below. You can navigate through the pages in the report by either clicking on the pages listed below, or by using the keyword search tool below to find specific information within the annual report.-
 1
1 -
2
-
3
-
4
-
5
-
6
-
7
-
8
-
9
-
10
-
11
-
12
-
13
-
14
-
15
-
 16
16 -
 17
17 -
 18
18 -
 19
19 -
 20
20 -
 21
21 -
 22
22 -
 23
23 -
 24
24 -
 25
25 -
 26
26 -
 27
27 -
 28
28 -
 29
29 -
 30
30 -
 31
31 -
 32
32 -
 33
33 -
 34
34 -
 35
35 -
 36
36 -
37
-
38
-
39
-
40
-
41
-
42
-
43
-
44
-
45
-
46
-
47
-
48
-
49
-
50
-
51
-
52
-
53
-
54
-
55
-
56
-
57
-
58
-
59
-
60
-
61
-
62
-
63
-
64
-
65
-
66
-
67
-
68
-
69
-
70
-
71
-
72
-
73
-
74
-
75
-
76
-
77
-
78
-
79
-
80
-
81
-
82
-
83
-
84
-
85
-
86
-
87
-
88
-
89
-
90
-
91
-
92
-
93
-
94
-
95
-
96
-
97
-
98
-
99
-
100
-
101
-
102
-
103
-
104
-
105
-
106
-
107
-
108
-
109
-
110
-
111
-
112
-
113
-
114
-
115
-
116
-
117
-
118
-
119
-
120
-
121
-
122
-
123
-
124
-
125
-
126
-
127
-
128
-
129
-
130
-
131
-
132
-
133
-
134
-
135
-
136
-
137
-
138
-
139
-
140
-
141
-
142
-
143
-
144
-
145
-
146
-
147
-
148
-
149
-
150
-
151
-
152
-
153
-
154
-
155
-
156
-
157
-
158
-
159
-
160
-
161
-
162
-
163
-
164
-
165
-
166
-
167
-
168
-
169
-
170
-
171
-
172
-
173
-
174
-
175
-
176
-
177
-
178
-
179
-
180
-
181
-
182
-
183
-
184
-
185
-
186
-
187
-
188
-
189
-
190
-
191
-
192
-
193
-
194
-
195
-
196
-
197
-
198
-
199
-
200
-
201
-
202
-
203
-
204
-
205
-
206
-
207
-
208
-
209
 |
 |

25 Report on Operations Analysis of the Financial Position and Operating Results
of the Fiat Group and Fiat S.p.A
❚Current liabilities include those to be settled in the normal
course of business, liabilities held primarily for trading
purposes, and those due within twelve months of the
year-end or which cannot be renegotiated in that period.
The following analysis provides the information necessary
for correlation with the principal items characteristic of
the industrial activities, such as working capital and net
invested capital.
For a more complete analysis of these items, please see
the Notes to the Consolidated Financial Statements.
Balance Sheet
The financial structure shows items on both the assets
and liabilities side, with a breakdown between current
and non-current assets and liabilities. Specifically:
❚In addition to cash and securities, current assets include
assets held for sale or consumption in the normal course
of business and thus comprise assets generated by financial
services, including assets under financial lease. Current assets
also include amounts which are expected to be received
within twelve months of the year-end.
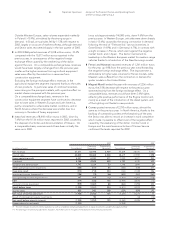
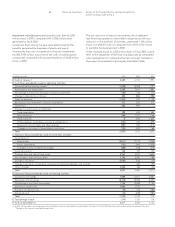
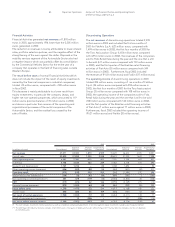
(in millions of euros) At 12.31.2003 At 12.31.2002
❚ASSETS
Intangible fixed assets 3,724 5,200
Intangible fixed assets 1,322 1,600
Goodwill 2,402 3,600
Property, plant and equipment 9,675 12,106
Property, plant and equipment 8,761 10,521
Operating leases 914 1,585
Financial fixed assets 3,950 6,638
Investments on behalf of life insurance policyholders who bear the risk – 6,930
Financial receivables held as fixed assets (*) 29 48
Deferred tax assets 1,879 3,499
Total Non-Current Assets 19,257 34,421
Net inventories (1) 6,912 7,050
Trade receivables 4,553 5,784
Other receivables 3,081 3,351
Financial assets not held as fixed assets 120 6,094
Finance lease contracts receivable (*) 1,797 2,947
Financial receivables from others (*) 10,750 18,411
Securities (*) 3,789 1,507
Cash (*) 3,211 3,489
Total Current Assets 34,213 48,633
Trade accruals and deferrals 407 579
Financial accruals and deferrals (*) 386 661
❚TOTAL ASSETS 54,263 84,294
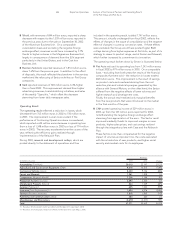
❚LIABILITIES AND STOCKHOLDERS’ EQUITY
Stockholders’ equity 7,494 8,679
Stockholders’ equity of the Group 6,793 7,641
Minority interest 701 1,038
Deferred income tax reserves 211 1,236
Reserves for risks and charges 5,168 15,390
Reserves for employee severance indemnities 1,313 1,609
Policy liabilities and accruals where the investment risk is borne by policyholders – 7,000
Long-term financial payables (*) 15,418 20,613
Total Non-Current Liabilities 22,110 45,848
Trade payables 12,588 13,267
Other payables 3,170 4,771
Short-term financial payables (2) (*) 6,616 8,310
Total Current Liabilities 22,374 26,348
Trade accruals and deferrals 1,329 1,499
Financial accruals and deferrals (*) 956 1,920
❚TOTAL LIABILITIES AND STOCKHOLDERS’ EQUITY 54,263 84,294
❚NET FINANCIAL POSITION (*) (3,028) (3,780)
(1) Net of advances received for contract work in progress (8,448 million euros at December 31, 2003 and 8,227 million euros at December 31, 2002).
(2) The item includes the 1,765-million-euro exchangeable bond payable in 2004.