Capital One 2006 Annual Report Download - page 98
Download and view the complete annual report
Please find page 98 of the 2006 Capital One annual report below. You can navigate through the pages in the report by either clicking on the pages listed below, or by using the keyword search tool below to find specific information within the annual report.-
 1
1 -
2
-
3
-
4
-
5
-
6
-
7
-
8
-
9
-
10
-
11
-
12
-
13
-
14
-
15
-
16
-
17
-
18
-
19
-
20
-
21
-
22
-
23
-
24
-
25
-
26
-
27
-
28
-
29
-
30
-
31
-
32
-
33
-
34
-
35
-
36
-
37
-
38
-
39
-
40
-
41
-
42
-
43
-
44
-
45
-
46
-
47
-
48
-
49
-
50
-
51
-
52
-
53
-
54
-
55
-
56
-
57
-
58
-
59
-
60
-
61
-
62
-
63
-
64
-
65
-
66
-
67
-
68
-
69
-
70
-
71
-
72
-
73
-
74
-
75
-
76
-
77
-
78
-
79
-
80
-
81
-
82
-
83
-
84
-
85
-
86
-
87
-
 88
88 -
 89
89 -
 90
90 -
 91
91 -
 92
92 -
 93
93 -
 94
94 -
 95
95 -
 96
96 -
 97
97 -
 98
98 -
 99
99 -
 100
100 -
 101
101 -
 102
102 -
 103
103 -
 104
104 -
 105
105 -
 106
106 -
 107
107 -
 108
108 -
109
-
110
-
111
-
112
-
113
-
114
-
115
-
116
-
117
-
118
-
119
-
120
-
121
-
122
-
123
-
124
-
125
-
126
-
127
-
128
-
129
-
130
-
131
-
132
-
133
-
134
-
135
-
136
-
137
-
138
-
139
-
140
-
141
-
142
-
143
-
144
-
145
-
146
-
147
-
148
 |
 |

80
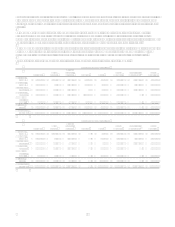
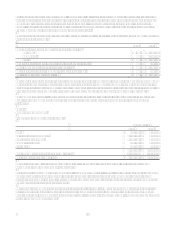
Year Ended December 31, 2004
U.S. Card Auto
Finance
Global
Financial
Services Banking Other Total
Managed Securitization
Adjustments(1) Total
Reported
Net interest
income $ 4,655,897 $ 797,936 $ 1,421,508 $ $ (240,599) $ 6,634,742 $ (3,631,764) $ 3,002,978
Non-interest
income 3,219,567 80,712 844,192 80,115 4,224,586 1,675,571 5,900,157
Provision for
loan losses 2,207,888 279,981 683,612 5,564 3,177,045 (1,956,193) 1,220,852
Non-interest
expenses 3,499,918 342,761 1,265,549 213,991 5,322,219 5,322,219
Income tax
provision
(benefit) 780,357 92,126 103,459 (159,360) 816,582 816,582
Net income
(loss) $ 1,387,301 $ 163,780 $ 213,080 $ $ (220,679) $ 1,543,482 $ $ 1,543,482
Loans held for
investment $ 48,609,571 $ 9,997,497 $ 21,240,325 $ $ 13,906 $ 79,861,299 $ (41,645,708) $ 38,215,591
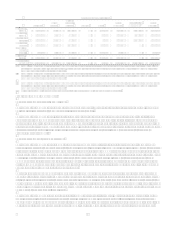
(1) Income statement adjustments for the year ended December 31, 2006 reclassify the net of finance charges of $5,485.0 million, past due fees of $938.6 million,
interest income of $(239.7) million and interest expense of $2,342.7 million; and net charge-offs of $1,747.5 million to Non-interest income from Net interest
income and Provision for loan losses, respectively.
Income statement adjustments for the year ended December 31, 2005 reclassify the net of finance charges of $5,052.8 million, past due fees of $1,006.1 million,
interest income of $(196.4) million and interest expense of $1,887.3 million; and net charge-offs of $2,176.5 million to Non-interest income from Net interest
income and Provision for loan losses, respectively.
Income statement adjustments for the year ended December 31, 2004 reclassify the net of finance charges of $4,340.1 million, past due fees of $1,042.2 million,
interest income of $(195.5) million and interest expense of $1,555.0 million; and net charge-offs of $1,956.2 million to Non-interest income from Net interest
income and Provision for loan losses, respectively.
(2) For 2006, other segment includes North Fork Bank results. For 2005, other segment includes Hibernia Bank results.
Significant Segment Adjustments
Non-recurring Non Interest Income Items
During 2005, the Company sold previously purchased charged-off loan portfolios resulting in a gain of $34.0 million which
was reported in non-interest income and held in the Other category.
During 2004, the Company sold its interest in a South African joint venture with a book value of $3.9 million to its joint
venture partner. The Company received $26.2 million in cash, was forgiven $9.2 million in liabilities and recognized a pre-
tax gain of $31.5 million. Also during 2004, the Company sold its French loan portfolio with a book value of $144.8 million
to an external party. The Company received $178.7 million in cash, recorded $7.2 million in notes receivables and recognized
a pre-tax gain of $41.1 million. The respective gains were recorded in non-interest income and reported in the Global
Financial Services segment.
Non-recurring Operating Expense Items
During 2006, the Company sold a number of Treasury and Agency securities realizing a loss of $34.9 million which was
reported in non-interest expense and held in the Other category. In addition, the Company reclassified to Mortgage loans held
for sale $4.2 billion of North Forks mortgage portfolio and $1.5 billion of CONAs residential mortgage portfolio as part of
a balance sheet downsizing plan in connection with the acquisition of North Fork resulting in a loss of $21.4 million from the
mark to lower of cost or market which was reported in mortgage banking operations income in the Other category. The
Company entered into freestanding interest rate swaps to mitigate the interest rate exposure on the mortgage loans held for
sale. The Company recognized a mark-to-market gain on the freestanding interest rates swaps of $35.7 million in Mortgage
banking operations income held in the Other category.
During the years ended December 31, 2005 and 2004, the Company recognized non-interest expense of $76.3 million and
$161.2 million, respectively, for employee termination and facility consolidation charges related to continued cost reduction
initiatives and other less material one-time charges. Of these amounts, $41.7 million and $109.6 million was allocated to the
U.S. Card segment, $24.9 million and $45.4 million was allocated to the Global Financial Services segment, $8.5 million and
$4.5 million was allocated to the Auto Finance segment and the remainder was held in the Other category for the years ended
December 31, 2005 and 2004, respectively.
During 2005, the Company closed on the sale of its Tampa, Florida facilities. The ultimate sales price was greater than the
impaired value of the held-for-sale property, and as such, the Company reversed $18.8 million of its previously recorded
2004 impairment in Occupancy expense. Of this amount, $17.4 million was allocated to the U.S. Card segment, $1.3 million
was allocated to the Global Financial Services segment, and the remainder of the balance was held in the Other category.