Capital One 2006 Annual Report Download - page 57
Download and view the complete annual report
Please find page 57 of the 2006 Capital One annual report below. You can navigate through the pages in the report by either clicking on the pages listed below, or by using the keyword search tool below to find specific information within the annual report.-
 1
1 -
2
-
3
-
4
-
5
-
6
-
7
-
8
-
9
-
10
-
11
-
12
-
13
-
14
-
15
-
16
-
17
-
18
-
19
-
20
-
21
-
22
-
23
-
24
-
25
-
26
-
27
-
28
-
29
-
30
-
31
-
32
-
33
-
34
-
35
-
36
-
37
-
38
-
39
-
40
-
41
-
42
-
43
-
44
-
45
-
46
-
 47
47 -
 48
48 -
 49
49 -
 50
50 -
 51
51 -
 52
52 -
 53
53 -
 54
54 -
 55
55 -
 56
56 -
 57
57 -
 58
58 -
 59
59 -
 60
60 -
 61
61 -
 62
62 -
 63
63 -
 64
64 -
 65
65 -
 66
66 -
 67
67 -
68
-
69
-
70
-
71
-
72
-
73
-
74
-
75
-
76
-
77
-
78
-
79
-
80
-
81
-
82
-
83
-
84
-
85
-
86
-
87
-
88
-
89
-
90
-
91
-
92
-
93
-
94
-
95
-
96
-
97
-
98
-
99
-
100
-
101
-
102
-
103
-
104
-
105
-
106
-
107
-
108
-
109
-
110
-
111
-
112
-
113
-
114
-
115
-
116
-
117
-
118
-
119
-
120
-
121
-
122
-
123
-
124
-
125
-
126
-
127
-
128
-
129
-
130
-
131
-
132
-
133
-
134
-
135
-
136
-
137
-
138
-
139
-
140
-
141
-
142
-
143
-
144
-
145
-
146
-
147
-
148
 |
 |
39
Non-interest expense increased 22% for the year ended December 31, 2006, reflecting a 5% increase in marketing spend and
a 27% increase in operating expenses. Non-interest expense increased $1.2 billion for the year, of which $0.9 billion reflected
a full years worth of Hibernias operations and $0.1 billion from the North Fork acquisition. In addition, the Company made
infrastructure investments which include the successful conversion to a new installment loan platform in July 2006, the
ongoing conversions to the Companys new card holder platform, and branch expansion in the Banking segment.
Non-interest expense increased 7% for the year ended December 31, 2005, reflecting flat marketing spend and a 9% increase
in operating expenses. The increase in operating expenses was driven primarily by the 2005 acquisitions and slightly higher
2005 one-time charges, offset by lower 2005 charges related to the companys corporate-wide cost reduction initiatives
announced in 2004. Companies acquired in 2005 contributed $303.8 million in operating expenses or 86% of the overall
increase. In addition, the company recognized a $20.6 million pre-payment penalty related to the refinancing of the McLean
headquarters facility and a $28.2 million impairment charge related to its Global Financial Services segment insurance
brokerage business compared to a total of $36.4 million in 2004 one-time charges detailed below. 2005 operating expenses
were positively impacted by a $67.3 million reduction in employee termination benefits and facility consolidation costs
related to corporate-wide cost reduction initiatives. Excluding the aforementioned items, operating expenses increased 2% for
the year ended December 31, 2005. This increase was the result of 7% managed loan growth, excluding 2005 acquisitions,
and reflects improved operating efficiencies. Operating expenses as a percentage of average managed assets for the year
ended December 31, 2005 fell 33 basis points to 4.12% from 4.45% for the prior year.
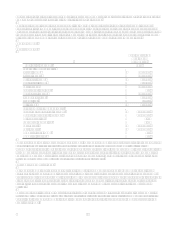
Income Taxes
The Companys effective tax rate was 33.9%, 36.1%, and 34.6% for the years ended December 31, 2006, 2005, and 2004,
respectively. The effective rate includes federal, state, and international tax components. The decrease in the 2006 rate
compared to 2005 was primarily due to the resolution of certain tax issues and audits for prior years with the Internal
Revenue Service resulting in $70.7 million reduction to provision. The increase in the 2005 rate compared to 2004 was
primarily due to changes in the Companys international tax positions.
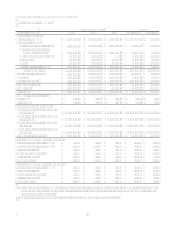
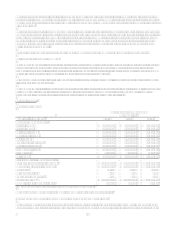
Loan Portfolio Summary
The Company analyzes its financial performance on a managed loan portfolio basis. The managed loan portfolio is comprised
of on-balance sheet and off-balance sheet loans. The Company has retained servicing rights for its securitized loans and
receives servicing fees in addition to the excess spread generated from the off-balance sheet loan portfolio.
Average managed loans held for investment grew 31%, or $26.1 billion and 16%, or $11.6 billion for the years ended
December 31, 2006 and 2005, respectively. The increase in average managed loans held for investment included $2.7 billion
from the North Fork acquisition in 2006, and $16.1 billion from the Hibernia acquisition in 2005.
For additional information, see section XII, Tabular Summary, Table C (Managed Consumer Loan Portfolio) and Table D
(Composition of Reported Loan Portfolio).
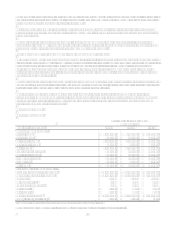
Asset Quality
Delinquencies
The Company believes delinquencies to be an indicator of loan portfolio credit quality at a point in time. The entire balance
of an account is contractually delinquent if the minimum payment is not received by the payment due date. Delinquencies not
only have the potential to impact earnings if the account charges off, but they also result in additional costs in terms of the
personnel and other resources dedicated to resolving the delinquencies.
The 30-plus day delinquency rate for the reported and managed consumer loan portfolio decreased 40 and 22 basis points,
respectively, at December 31, 2006. The reduction in the reported and managed consumer loan 30-plus day delinquency rates
reflect a higher concentration of lower loss assets in the respective loan portfolios (including $31.7 billion loans added
through the acquisition of North Fork).
The 30-plus day delinquency rate for the reported and managed consumer loan portfolio decreased 71 and 58 basis points,
respectively, at December 31, 2005. The reduction in the reported and managed consumer loan 30-plus day delinquency rates
reflect a higher concentration of lower loss assets in the respective loan portfolios (including $16.3 billion loans added
through the acquisition of Hibernia), the clearing out of delinquencies related to recent bankruptcy related charge-offs and
overall improved collections experience.
For additional information, see section XII, Tabular Summary, Table E (Delinquencies).