Capital One 2006 Annual Report Download - page 65
Download and view the complete annual report
Please find page 65 of the 2006 Capital One annual report below. You can navigate through the pages in the report by either clicking on the pages listed below, or by using the keyword search tool below to find specific information within the annual report.-
 1
1 -
2
-
3
-
4
-
5
-
6
-
7
-
8
-
9
-
10
-
11
-
12
-
13
-
14
-
15
-
16
-
17
-
18
-
19
-
20
-
21
-
22
-
23
-
24
-
25
-
26
-
27
-
28
-
29
-
30
-
31
-
32
-
33
-
34
-
35
-
36
-
37
-
38
-
39
-
40
-
41
-
42
-
43
-
44
-
45
-
46
-
47
-
48
-
49
-
50
-
51
-
52
-
53
-
54
-
 55
55 -
 56
56 -
 57
57 -
 58
58 -
 59
59 -
 60
60 -
 61
61 -
 62
62 -
 63
63 -
 64
64 -
 65
65 -
 66
66 -
 67
67 -
 68
68 -
 69
69 -
 70
70 -
 71
71 -
 72
72 -
 73
73 -
 74
74 -
 75
75 -
76
-
77
-
78
-
79
-
80
-
81
-
82
-
83
-
84
-
85
-
86
-
87
-
88
-
89
-
90
-
91
-
92
-
93
-
94
-
95
-
96
-
97
-
98
-
99
-
100
-
101
-
102
-
103
-
104
-
105
-
106
-
107
-
108
-
109
-
110
-
111
-
112
-
113
-
114
-
115
-
116
-
117
-
118
-
119
-
120
-
121
-
122
-
123
-
124
-
125
-
126
-
127
-
128
-
129
-
130
-
131
-
132
-
133
-
134
-
135
-
136
-
137
-
138
-
139
-
140
-
141
-
142
-
143
-
144
-
145
-
146
-
147
-
148
 |
 |

47
In March 2005, COAF entered into a revolving warehouse credit facility collateralized by a security interest in certain auto
loan assets (the Capital One Auto Loan Facility II). As of December 31, 2006, the Capital One Auto Loan Facility II had
the capacity to issue up to $1.8 billion in secured notes. The facility does not have a final maturity date. Instead, the
participant may elect to renew the commitment for another set period of time. Interest on the facility is based on commercial
paper rates.
In May 2006, the Company entered into a syndicated bridge loan facility (the Facility). The Facility was available to the
Company to finance, on an interim basis, the cash consideration payable to shareholders of North Fork in connection with the
acquisition. On September 29, 2006 the Facility was terminated.
As of December 31, 2006, the Corporation had an effective shelf registration statement under which the Corporation from
time to time may offer and sell an indeterminate aggregate amount of senior or subordinated debt securities, preferred stock,
depositary shares representing preferred stock, common stock, trust preferred securities, junior subordinated debt securities,
guarantees of trust preferred securities and certain back-up obligations, purchase contracts and units. There is no limit under
this shelf registration statement to the amount or number of such securities that the Corporation may offer and sell.
Deposits
The Company continues to expand its retail deposit gathering efforts through its direct marketing channels, the existing
branch network and through De Novo branch expansion. Deposits from the direct marketing business continued to grow due
to expansion in marketed channels, such as the internet.
With the acquisitions of North Fork and Hibernia, Capital One acquired new channels for deposit growth. The branch
network offers a broad set of deposit products that include demand deposits, money market deposits, NOW accounts, and
certificates of deposits (CDs).
As of December 31, 2006, the Company had $85.8 billion in deposits of which $4.0 billion were held in foreign banking
offices and $12.0 billion represented large domestic denomination certificates of $100 thousand or more.
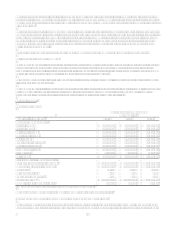
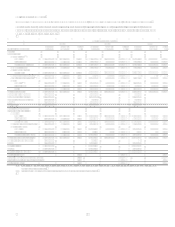
Table 7 shows the maturities of domestic time certificates of deposit in denominations of $100 thousand or greater (large
denomination CDs) as of December 31, 2006.
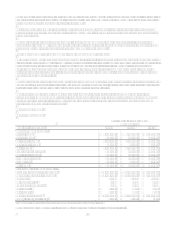
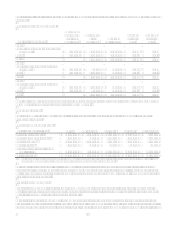
Table 7: Maturities of Large Denomination Certificates$100,000 or More
December 31, 2006
(Dollars in thousands) Balance Percent
Three months or less $ 3,221,810 26.9%
Over 3 through 6 months 2,462,527 20.5%
Over 6 through 12 months 2,188,443 18.3%
Over 12 months through 10 years 4,118,587 34.3%
Total $ 11,991,367 100.0%
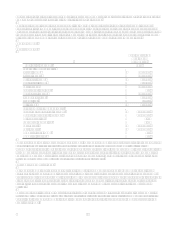
Table 8 shows the composition of average deposits for the periods presented.
Table 8: Deposit Composition and Average Deposit Rates
Year Ended December 31, 2006
Average
Balance
% of
Deposits
Average
Deposit
Rate
Non-interest bearingdomestic $ 4,906,313 9.68% N/A
NOW accounts 974,126 1.92% 2.75%
Money market deposit accounts 12,213,502 24.10% 3.42%
Savings Accounts 4,248,016 8.38% 2.58%
Other consumer time deposits 14,904,790 29.41% 4.31%
Total core deposits 37,246,747 73.49% 3.21%
Public fund certificate of deposits of $100,000 or more 1,060,748 2.09% 7.33%
Certificates of deposit of $100,000 or more 8,814,475 17.40% 4.19%
Foreign time deposits 3,551,464 7.02% 4.80%
Total deposits $ 50,673,434 100.00% 3.58%