Capital One 2006 Annual Report Download - page 75
Download and view the complete annual report
Please find page 75 of the 2006 Capital One annual report below. You can navigate through the pages in the report by either clicking on the pages listed below, or by using the keyword search tool below to find specific information within the annual report.-
 1
1 -
2
-
3
-
4
-
5
-
6
-
7
-
8
-
9
-
10
-
11
-
12
-
13
-
14
-
15
-
16
-
17
-
18
-
19
-
20
-
21
-
22
-
23
-
24
-
25
-
26
-
27
-
28
-
29
-
30
-
31
-
32
-
33
-
34
-
35
-
36
-
37
-
38
-
39
-
40
-
41
-
42
-
43
-
44
-
45
-
46
-
47
-
48
-
49
-
50
-
51
-
52
-
53
-
54
-
55
-
56
-
57
-
58
-
59
-
60
-
61
-
62
-
63
-
64
-
 65
65 -
 66
66 -
 67
67 -
 68
68 -
 69
69 -
 70
70 -
 71
71 -
 72
72 -
 73
73 -
 74
74 -
 75
75 -
 76
76 -
 77
77 -
 78
78 -
 79
79 -
 80
80 -
 81
81 -
 82
82 -
 83
83 -
 84
84 -
 85
85 -
86
-
87
-
88
-
89
-
90
-
91
-
92
-
93
-
94
-
95
-
96
-
97
-
98
-
99
-
100
-
101
-
102
-
103
-
104
-
105
-
106
-
107
-
108
-
109
-
110
-
111
-
112
-
113
-
114
-
115
-
116
-
117
-
118
-
119
-
120
-
121
-
122
-
123
-
124
-
125
-
126
-
127
-
128
-
129
-
130
-
131
-
132
-
133
-
134
-
135
-
136
-
137
-
138
-
139
-
140
-
141
-
142
-
143
-
144
-
145
-
146
-
147
-
148
 |
 |

57
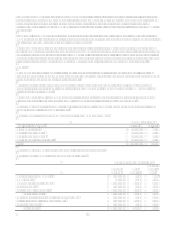
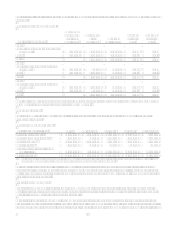
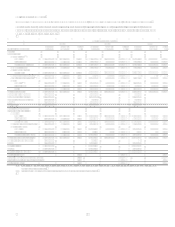
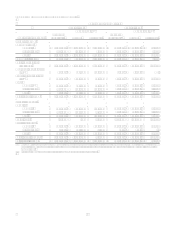
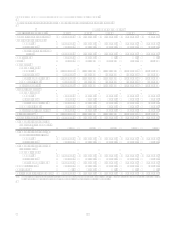
TABLE BINTEREST VARIANCE ANALYSIS
Year Ended December 31
2006 vs. 2005 2005 vs. 2004
Change due to(1) Change due to(1)
(Dollars in thousands) Increase
(Decrease) Volume Yield/Rate
Increase
(Decrease)(2) Volume Yield/Rate
Interest Income:
Consumer loans
Domestic $ 1,759,916 $ 1,969,744 $ (209,828) $ 612,475 $ 598,259 $ 14,216
International (19,526) (27,114) 7,588
62,268 60,266 2,002
Total 1,740,390 1,921,082 (180,692) 674,743 657,861 16,882
Commercial loans 295,244 404,940 (109,696) 101,676 98,202 3,474
Total loans held for
investment 2,035,634 2,573,519 (537,885) 776,419 795,804 (19,385)
Mortgage loans held for
sale(2) 62,264 72,597 (10,333) 8,799 8,799
Securities available for
sale(2) 289,816 201,138 88,678
74,595 44,860 29,735
Other
Domestic(2) 108,620 66,702 41,918
48,188 50,865 (2,677)
International (28,986) (15,214) (13,772) 24,460 26,793 (2,333)
Total 79,634 37,935 41,699
72,648 79,901 (7,253)
Total interest income 2,467,348 2,828,419 (361,071) 932,461 915,772 16,689
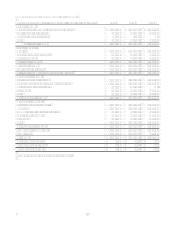
Interest Expense:
Deposits
Domestic 657,775 689,359 (31,584) 126,868 134,163 (7,295)
International (16,115) (10,062) (6,053) 36,724 37,769 (1,045)
Total 641,660 690,927 (49,267) 163,592 167,793 (4,201)
Senior notes (9,575) (12) (9,563) (65,594) (25,007) (40,587)
Other borrowings
Domestic 406,252 264,862 141,390
156,696 102,739 53,957
International 9,623 10,351 (728) 503 511 (8)
Total 415,875 310,748 105,127
157,199 103,292 53,907
Total interest expense 1,047,960 1,056,736 (8,776) 255,197 281,105 (25,908)
Net interest income $ 1,419,388 $ 1,773,970 $ (354,582) $ 677,264 $ 586,265 $ 90,999
(1) The change in interest due to both volume and rates has been allocated in proportion to the relationship of the absolute dollar amounts of the change in each. The
changes in income and expense are calculated independently for each line in the table. The totals for the volume and yield/rate columns are not the sum of the
individual lines.
(2) Prior period amounts have been reclassified to conform with current period presentation.