Capital One 2006 Annual Report Download - page 56
Download and view the complete annual report
Please find page 56 of the 2006 Capital One annual report below. You can navigate through the pages in the report by either clicking on the pages listed below, or by using the keyword search tool below to find specific information within the annual report.-
 1
1 -
2
-
3
-
4
-
5
-
6
-
7
-
8
-
9
-
10
-
11
-
12
-
13
-
14
-
15
-
16
-
17
-
18
-
19
-
20
-
21
-
22
-
23
-
24
-
25
-
26
-
27
-
28
-
29
-
30
-
31
-
32
-
33
-
34
-
35
-
36
-
37
-
38
-
39
-
40
-
41
-
42
-
43
-
44
-
45
-
 46
46 -
 47
47 -
 48
48 -
 49
49 -
 50
50 -
 51
51 -
 52
52 -
 53
53 -
 54
54 -
 55
55 -
 56
56 -
 57
57 -
 58
58 -
 59
59 -
 60
60 -
 61
61 -
 62
62 -
 63
63 -
 64
64 -
 65
65 -
 66
66 -
67
-
68
-
69
-
70
-
71
-
72
-
73
-
74
-
75
-
76
-
77
-
78
-
79
-
80
-
81
-
82
-
83
-
84
-
85
-
86
-
87
-
88
-
89
-
90
-
91
-
92
-
93
-
94
-
95
-
96
-
97
-
98
-
99
-
100
-
101
-
102
-
103
-
104
-
105
-
106
-
107
-
108
-
109
-
110
-
111
-
112
-
113
-
114
-
115
-
116
-
117
-
118
-
119
-
120
-
121
-
122
-
123
-
124
-
125
-
126
-
127
-
128
-
129
-
130
-
131
-
132
-
133
-
134
-
135
-
136
-
137
-
138
-
139
-
140
-
141
-
142
-
143
-
144
-
145
-
146
-
147
-
148
 |
 |
38
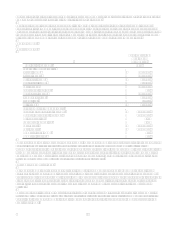
Mortgage Banking Operations Income
Mortgage banking operations income includes commission and fees earned by the Companys mortgage businesses, gains
and losses associated with hedging transactions, gains and losses on sale of mortgage loans held for sale, and lower of cost or
market adjustments to the held for sale loan portfolio. Mortgage banking operations income increased 21% from prior year
due to the acquisition of North Fork.
Interchange
Interchange income, net of rewards expense, increased 7% for the year ended December 31, 2006. This increase is primarily
related to a 13% increase in purchase volumes. Costs associated with the Companys rewards programs were $176.3 million
and $176.9 million for the years ended December 31, 2006 and 2005, respectively.
Interchange income, net of rewards expense, increased 8% for the year ended December 31, 2005. This increase is primarily
related to a 15% increase in purchase volumes. Costs associated with the Companys rewards programs was $176.9 million
and $128.2 million for the years ended December 31, 2005 and 2004, respectively. The 38% increase in the rewards expense
is due to an increase in purchase volumes and the continued expansion of the rewards program during 2005.
Other Non-Interest Income
Other non-interest income includes, among other items, gains and losses on sales of securities, gains and losses associated
with hedging transactions, service provider revenue generated by the Companys healthcare finance business, gains on the
sale of auto loans and income earned related to purchased charged-off loan portfolios.
Other non-interest income for the year ended December 31, 2006, increased $32.2 million. The increase is primarily the
result of a $59.8 million gain from the sale of purchased charged-off loan portfolios, a $20.5 million gain from the share
redemption in connection with the MasterCard, Inc. initial public offering, a $28.6 million increase in the revenue related to
back end performance bonuses related to prior period auto loan sales compared to same periods in prior years, offset by a
$50.1 million negative fair value adjustment on the derivatives instruments entered into in anticipation of the North Fork
Bank acquisition, and a $12.4 million loss recorded in connection with the extinguishment of senior notes during the first
quarter of 2006, and $12.4 million income recognized in the prior year from the Companys charged off loan portfolio which
was disposed of in February 2006.
Other non-interest income for the year ended December 31, 2005, included $160.0 million of income related to businesses
acquired during 2005. Exclusive of the income generated from businesses acquired, other non-interest income decreased 20%
from the prior year. This decrease is primarily the result of gains recognized in 2004, including a $31.5 million gain from the
sale of the Companys joint venture investment in South Africa and a $41.1 million gain from the sale of the French loan
portfolio, as well as, a $26.3 million reduction in gains recognized from the sale of auto loans in 2005 due to lower volume of
whole loan sales. These reductions in 2005 in other non-interest income were partially offset by a $34.0 million gain from the
sale of previously purchased charged-off loan portfolios during 2005.
Provision for loan losses
Exclusive of the North Fork acquisition, the provision for loan losses decreased 1% for the year ended December 31, 2006,
compared to the prior year. The decrease in the provision is as a result of a continued increase in the concentration of higher
credit quality loans in the reported loan portfolio combined with a continued favorable loss environment resulting from, in
part, a slower than expected return of bankruptcy related charge-offs to historical levels. During 2006, the Company
determined that $25.7 million of allowance for loan losses previously established to cover expected losses in the portion of
the loan portfolio impacted by the 2005 hurricanes was no longer needed.
The provision for loan losses increased 22% for the year ended December 31, 2005 compared to the prior year. This increase
was driven by 14% growth in the reported loan portfolio, exclusive of Hibernia loans acquired, estimated losses resulting
from the Gulf Coast hurricanes, and an increase in net charge-offs resulting from the enactment of the new bankruptcy
legislation. Exclusive of the estimated losses from the Gulf Coast Hurricanes and the increase in bankruptcy related charge-
offs in 2005 compared to 2004, the provision for loan losses would have increased 8% from the prior year. This provision for
loan losses increase relative to the 14% growth in the reported loan portfolio reflects a continued increase in the concentration
of higher credit quality loans in the reported loan portfolio.
Non-interest expense
Non-interest expense consists of marketing and operating expenses.