Capital One 2006 Annual Report Download - page 63
Download and view the complete annual report
Please find page 63 of the 2006 Capital One annual report below. You can navigate through the pages in the report by either clicking on the pages listed below, or by using the keyword search tool below to find specific information within the annual report.-
 1
1 -
2
-
3
-
4
-
5
-
6
-
7
-
8
-
9
-
10
-
11
-
12
-
13
-
14
-
15
-
16
-
17
-
18
-
19
-
20
-
21
-
22
-
23
-
24
-
25
-
26
-
27
-
28
-
29
-
30
-
31
-
32
-
33
-
34
-
35
-
36
-
37
-
38
-
39
-
40
-
41
-
42
-
43
-
44
-
45
-
46
-
47
-
48
-
49
-
50
-
51
-
52
-
 53
53 -
 54
54 -
 55
55 -
 56
56 -
 57
57 -
 58
58 -
 59
59 -
 60
60 -
 61
61 -
 62
62 -
 63
63 -
 64
64 -
 65
65 -
 66
66 -
 67
67 -
 68
68 -
 69
69 -
 70
70 -
 71
71 -
 72
72 -
 73
73 -
74
-
75
-
76
-
77
-
78
-
79
-
80
-
81
-
82
-
83
-
84
-
85
-
86
-
87
-
88
-
89
-
90
-
91
-
92
-
93
-
94
-
95
-
96
-
97
-
98
-
99
-
100
-
101
-
102
-
103
-
104
-
105
-
106
-
107
-
108
-
109
-
110
-
111
-
112
-
113
-
114
-
115
-
116
-
117
-
118
-
119
-
120
-
121
-
122
-
123
-
124
-
125
-
126
-
127
-
128
-
129
-
130
-
131
-
132
-
133
-
134
-
135
-
136
-
137
-
138
-
139
-
140
-
141
-
142
-
143
-
144
-
145
-
146
-
147
-
148
 |
 |

45
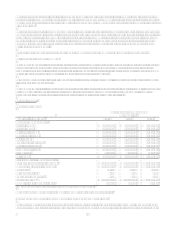
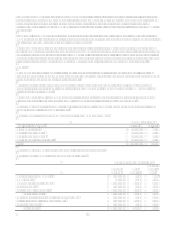
The provision for loan losses increased 35% for the year ended December 31, 2005, as a result of growth in the loan portfolio
combined with deteriorating credit quality metrics in the U.K. during 2005.
Non-interest expense in 2005 included a $28.2 million impairment charge related to the write-off of goodwill and other
charges related to the Companys insurance brokerage business. Non-interest expense in 2004 included expense associated
with a change in fixed asset capitalization thresholds and impairment of internally developed software. Exclusive of these one
time charges and a $20.5 million reduction in employee termination and facility consolidation charges, non-interest expense
for the year ended December 31, 2005, increased 18% in line with the 19% growth in average managed loans.
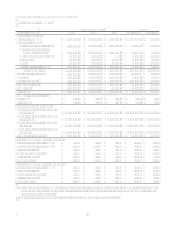
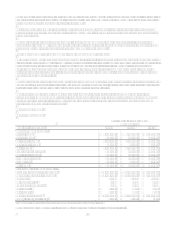
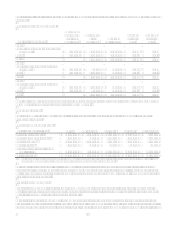
Banking Segment
Table 5: Banking
As of and for the
Year ended
December 31
(Dollars in thousands) 2006
Earnings (Managed Basis)
Interest income $ 2,773,973
Interest expense 1,777,044
Net interest income $ 996,929
Non-interest income 446,071
Total revenue 1,443,000
Provision for loan losses 399
Non-interest expense 1,167,873
Income before taxes 274,728
Income taxes 96,155
Net income $ 178,573
Selected Metrics (Managed Basis)
Period end loans held for investment $ 12,145,533
Average loans held for investment 13,225,559
Net charge-off rate 0.43%
30+ day delinquency rate 0.31%
Core deposits $ 27,071,324
Total deposits $ 35,334,610
Number of active ATMs 661
Number of locations 358
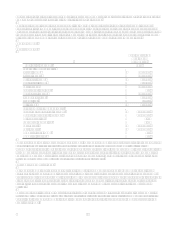
Beginning in 2006, Capital One added a Banking segment. The Banking segment represents the results of the legacy Hibernia
business lines except for the indirect auto business, which is included in the Auto Finance segment results, and the
investment portfolio results which are included in the Other category. In addition, the Banking segment includes the results of
the Companys branchless deposit business which were previously included as part of the Other category. On December 1,
2006, the Company completed its acquisition of North Fork Bancorporation. The impacts of the North Fork acquisition for
the one month ended December 31, 2006 are included in the Other category.
Year Ended December 31, 2006
The Banking segment contributed $178.6 million of income to the Company during 2006. At December 31, 2006, loans
outstanding in the Banking segment totaled $12.1 billion while deposits outstanding totaled $35.3 billion. Banking segment
profits are primarily generated from net interest income, which represents the spread between loan yields and the internal cost
of funds charged to the business for those loans, plus the spread between deposit interest costs and the funds transfer price
credited to the business for those deposits. During 2006, the Banking segment generated net interest income of $996.9
million.
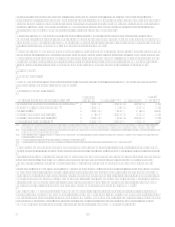
During 2006, overall loan growth was relatively flat as new loan originations were offset by significant loan repayments in
the areas most impacted by Hurricanes Katrina and Rita. In addition, during the fourth quarter the Company decided to sell
$1.5 billion of the Banking segments residential mortgage portfolio as part of the balance sheet downsizing related to the
acquisition of NFB.