Capital One 2006 Annual Report Download - page 60
Download and view the complete annual report
Please find page 60 of the 2006 Capital One annual report below. You can navigate through the pages in the report by either clicking on the pages listed below, or by using the keyword search tool below to find specific information within the annual report.-
 1
1 -
2
-
3
-
4
-
5
-
6
-
7
-
8
-
9
-
10
-
11
-
12
-
13
-
14
-
15
-
16
-
17
-
18
-
19
-
20
-
21
-
22
-
23
-
24
-
25
-
26
-
27
-
28
-
29
-
30
-
31
-
32
-
33
-
34
-
35
-
36
-
37
-
38
-
39
-
40
-
41
-
42
-
43
-
44
-
45
-
46
-
47
-
48
-
49
-
 50
50 -
 51
51 -
 52
52 -
 53
53 -
 54
54 -
 55
55 -
 56
56 -
 57
57 -
 58
58 -
 59
59 -
 60
60 -
 61
61 -
 62
62 -
 63
63 -
 64
64 -
 65
65 -
 66
66 -
 67
67 -
 68
68 -
 69
69 -
 70
70 -
71
-
72
-
73
-
74
-
75
-
76
-
77
-
78
-
79
-
80
-
81
-
82
-
83
-
84
-
85
-
86
-
87
-
88
-
89
-
90
-
91
-
92
-
93
-
94
-
95
-
96
-
97
-
98
-
99
-
100
-
101
-
102
-
103
-
104
-
105
-
106
-
107
-
108
-
109
-
110
-
111
-
112
-
113
-
114
-
115
-
116
-
117
-
118
-
119
-
120
-
121
-
122
-
123
-
124
-
125
-
126
-
127
-
128
-
129
-
130
-
131
-
132
-
133
-
134
-
135
-
136
-
137
-
138
-
139
-
140
-
141
-
142
-
143
-
144
-
145
-
146
-
147
-
148
 |
 |

42
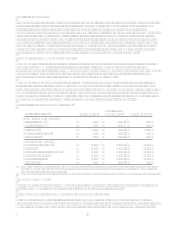
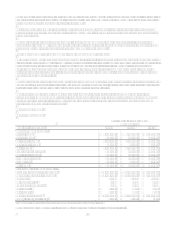
Ending Loans increased year over year by 8% and was driven by a combination of both new customer acquisitions as well as
growth and retention of balances from existing customers. Purchase Volume growth of 13% shows continued growth within
the rewards business along with healthy retail sales growth.
Total revenues declined 2% for the year, primarily driven by changes in product strategy. In the past year, U.S. Card has
increasingly focused on transactor products, shifted more upmarket in subprime cards and increased the volume of assets at
introductory rates.
The provision for loan losses decreased 28% for the year ended December 31, 2006. The decrease is attributable to the
favorable credit environment in 2006 and outlook for losses in 2007, offset by loan growth. Non-interest expenses for 2006
increased 5%, primarily driven by infrastructure improvements and investments.
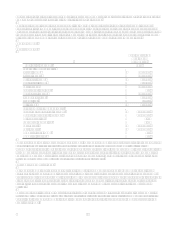
Year Ended December 31, 2005 Compared to Year Ended December 31, 2004
The U.S. Card segment provided earnings growth primarily as a result of year over year loan growth and improved operating
efficiencies. U.S. Card segment net income for 2005 grew as a result of higher revenue and lower non-interest expense, offset
by higher provision for loan losses. Total revenues grew 3% for the year, as a result of 2% growth in the average loan
portfolio coupled with higher purchase volumes. Current period earnings reflect the Companys choice not to engage in
certain repricing practices prevalent in the industry that focus on short-term growth at the expense of customer loyalty and
generating long-term profitability.
The provision for loan losses increased 3% for the year ended December 31, 2005. The increase is due to an increase in 2005
bankruptcy related charge-offs resulting from the enactment of new bankruptcy legislation, $10.0 million in estimated future
losses resulting from the Gulf Coast Hurricanes and growth in the loan portfolio.
Non-interest expense for 2005 included a $16.8 million expense allocation related to the prepayment penalty for the
refinancing of the McLean Headquarters facility and an $85.3 million reduction in charges associated with the Companys
continued cost reduction initiatives compared to 2004. Exclusive of these charges, non-interest expense decreased 2%,
reflecting improved operating efficiencies.
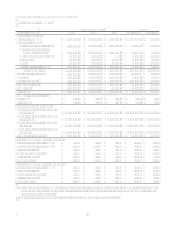
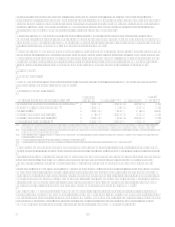
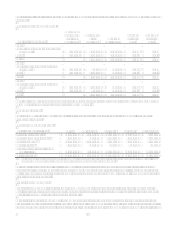
Auto Finance Segment
Table 3: Auto Finance
As of and for the Year Ended
December 31,
(Dollars in thousands) 2006 2005 2004
Earnings (Managed Basis)
Interest income $ 2,302,483 $ 1,657,505 $ 1,086,333
Interest expense 864,688 508,128 288,397
Net interest income 1,437,795 1,149,377 797,936
Non-interest income 16,106 19,951 80,712
Total revenue 1,453,901 1,169,328 878,648
Provision for loan losses 494,835 459,513 279,981
Non-interest expense 599,807 506,480 342,761
Income before taxes 359,259 203,335 255,906
Income taxes 125,740 71,268 92,126
Net income $ 233,519 $ 132,067 $ 163,780
Selected Metrics (Managed Basis)
Period end loans held for investment $ 21,751,827 $ 16,372,019 $ 9,997,497
Average loans held for investment $ 20,490,920 $ 14,177,631 $ 9,305,008
Loan Yield 11.24% 11.69% 11.67%
Net charge-off rate 2.28% 2.70% 3.28%
30+ day delinquency rate 6.35% 5.71% 5.50%
Core deposits $ 6,061 N/A N/A
Total deposits $ 6,061 N/A N/A
Auto loan originations(1) $ 12,285,307 $ 10,447,600 $ 6,677,120
Number of Accounts (000s) 1,589 1,217 730
(1) Includes all organic auto loan originations and excludes auto loans added through acquisitions.
The Auto Finance segment consists of automobile and other motor vehicle financing activities.