Capital One 2006 Annual Report Download - page 87
Download and view the complete annual report
Please find page 87 of the 2006 Capital One annual report below. You can navigate through the pages in the report by either clicking on the pages listed below, or by using the keyword search tool below to find specific information within the annual report.-
 1
1 -
2
-
3
-
4
-
5
-
6
-
7
-
8
-
9
-
10
-
11
-
12
-
13
-
14
-
15
-
16
-
17
-
18
-
19
-
20
-
21
-
22
-
23
-
24
-
25
-
26
-
27
-
28
-
29
-
30
-
31
-
32
-
33
-
34
-
35
-
36
-
37
-
38
-
39
-
40
-
41
-
42
-
43
-
44
-
45
-
46
-
47
-
48
-
49
-
50
-
51
-
52
-
53
-
54
-
55
-
56
-
57
-
58
-
59
-
60
-
61
-
62
-
63
-
64
-
65
-
66
-
67
-
68
-
69
-
70
-
71
-
72
-
73
-
74
-
75
-
76
-
 77
77 -
 78
78 -
 79
79 -
 80
80 -
 81
81 -
 82
82 -
 83
83 -
 84
84 -
 85
85 -
 86
86 -
 87
87 -
 88
88 -
 89
89 -
 90
90 -
 91
91 -
 92
92 -
 93
93 -
 94
94 -
 95
95 -
 96
96 -
 97
97 -
98
-
99
-
100
-
101
-
102
-
103
-
104
-
105
-
106
-
107
-
108
-
109
-
110
-
111
-
112
-
113
-
114
-
115
-
116
-
117
-
118
-
119
-
120
-
121
-
122
-
123
-
124
-
125
-
126
-
127
-
128
-
129
-
130
-
131
-
132
-
133
-
134
-
135
-
136
-
137
-
138
-
139
-
140
-
141
-
142
-
143
-
144
-
145
-
146
-
147
-
148
 |
 |

69
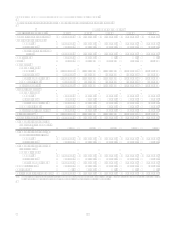
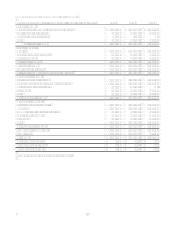
CONSOLIDATED STATEMENTS OF CASH FLOWS
Year Ended December 31 (In Thousands) 2006 2005 2004
Operating Activities:
Net Income $ 2,414,493
$ 1,809,147 $ 1,543,482
Adjustments to reconcile net income to cash provided by operating
activities:
Provision for loan losses 1,476,438
1,491,072 1,220,852
Depreciation and amortization, net 542,090
425,640 381,852
Impairment of long-lived assets
13,272 69,769
Losses on sales of securities available for sale 29,203
6,817 23,049
Gains on sales of auto loans (28,609) (14,087) (40,342)
Losses on repurchase of senior notes
12,444 4,287
Mortgage loans held for sale:
Transfers in and originations (4,402,957) (197,444)
Loss on sales 9,230
Proceeds from sales 3,525,000
Stock plan compensation expense 211,117
149,496 127,174
Changes in assets and liabilities, net of effects from purchase of
companies acquired:
Increase in interest receivable (45,311) (180,867) (38,562)
Decrease (increase) in accounts receivable from
securitizations 314,425
(658,805) 664,204
Decrease in other assets 158,060
164,229 282,960
Increase (decrease) in interest payable 87,005
92,906 (18,788)
(Decrease) increase in other liabilities (913,446) 550,043 269,373
Net cash provided by operating activities 3,376,738
3,663,863 4,489,310
Investing Activities:
Purchases of securities available for sale (7,777,082) (3,688,180) (6,539,370)
Proceeds from maturities of securities available for sale 4,289,139
2,009,517 1,713,373
Proceeds from sales of securities available for sale 6,891,187
909,697 1,274,862
Proceeds from sale of automobile loans
257,230 931,003
Proceeds from securitizations of loans 12,343,771
9,482,333 10,854,927
Net increase in loans held for investment (19,073,474) (16,627,879) (18,927,583)
Principal recoveries of loans previously charged off 547,304
448,351 453,705
Additions of premises and equipment, net (712,190) (159,823) (208,975)
Net (payment for) receipt from companies acquired (3,635,356) 450,562
Net cash used in investing activities (7,126,701) (6,918,192) (10,448,058)
Financing Activities:
Net increase in deposits 184,830
2,239,553 3,233,915
Net increase in other borrowings 2,006,101
2,923,270 1,840,148
Issuances of senior notes 3,185,272
1,262,035 998,190
Maturities of senior notes (1,226,882) (876,567) (1,031,892)
Repurchases of senior notes (31,296) (648,840) (128,747)
Purchases of treasury stock (21,615) (40,049) (17,232)
Dividends paid (32,324) (27,504) (25,618)
Net proceeds from issuances of common stock 36,751
770,311 23,910
Proceeds from share based payment activities 238,355
312,176 497,003
Net cash provided by financing activities 4,339,192
5,914,385 5,389,677
Increase (decrease) in cash and cash equivalents 589,229
2,660,056 (569,071)
Cash and cash equivalents at beginning of year 4,071,267
1,411,211 1,980,282
Cash and cash equivalents at end of year $ 4,660,496
$ 4,071,267 $ 1,411,211
See Notes to Consolidated Financial Statements.