Capital One 2006 Annual Report Download - page 85
Download and view the complete annual report
Please find page 85 of the 2006 Capital One annual report below. You can navigate through the pages in the report by either clicking on the pages listed below, or by using the keyword search tool below to find specific information within the annual report.-
 1
1 -
2
-
3
-
4
-
5
-
6
-
7
-
8
-
9
-
10
-
11
-
12
-
13
-
14
-
15
-
16
-
17
-
18
-
19
-
20
-
21
-
22
-
23
-
24
-
25
-
26
-
27
-
28
-
29
-
30
-
31
-
32
-
33
-
34
-
35
-
36
-
37
-
38
-
39
-
40
-
41
-
42
-
43
-
44
-
45
-
46
-
47
-
48
-
49
-
50
-
51
-
52
-
53
-
54
-
55
-
56
-
57
-
58
-
59
-
60
-
61
-
62
-
63
-
64
-
65
-
66
-
67
-
68
-
69
-
70
-
71
-
72
-
73
-
74
-
 75
75 -
 76
76 -
 77
77 -
 78
78 -
 79
79 -
 80
80 -
 81
81 -
 82
82 -
 83
83 -
 84
84 -
 85
85 -
 86
86 -
 87
87 -
 88
88 -
 89
89 -
 90
90 -
 91
91 -
 92
92 -
 93
93 -
 94
94 -
 95
95 -
96
-
97
-
98
-
99
-
100
-
101
-
102
-
103
-
104
-
105
-
106
-
107
-
108
-
109
-
110
-
111
-
112
-
113
-
114
-
115
-
116
-
117
-
118
-
119
-
120
-
121
-
122
-
123
-
124
-
125
-
126
-
127
-
128
-
129
-
130
-
131
-
132
-
133
-
134
-
135
-
136
-
137
-
138
-
139
-
140
-
141
-
142
-
143
-
144
-
145
-
146
-
147
-
148
 |
 |

67
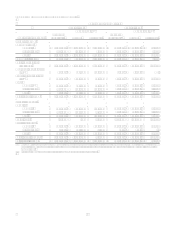
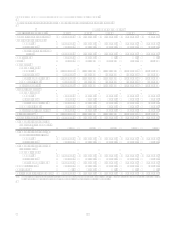
CONSOLIDATED STATEMENTS OF INCOME
Year Ended December 31 (In Thousands, Except Per Share Data) 2006 2005 2004
Interest Income:
Loans held for investment, including past-due fees $ 7,046,473 $ 5,010,839 $ 4,234,420
Securities available for sale 676,712
386,896 312,301
Mortgage loans held for sale 71,063
8,799
Other 399,981
320,347 247,699
Total interest income 8,194,229
5,726,881 4,794,420
Interest Expense:
Deposits 1,814,797
1,173,137 1,009,545
Senior and subordinated notes 411,643
421,218 486,812
Other borrowings 868,159
452,284 295,085
Total interest expense 3,094,599
2,046,639 1,791,442
Net interest income 5,099,630
3,680,242 3,002,978
Provision for loan losses 1,476,438
1,491,072 1,220,852
Net interest income after provision for loan losses 3,623,192
2,189,170 1,782,126
Non-Interest Income:
Servicing and securitizations 4,209,637
3,945,183 3,635,465
Service charges and other customer-related fees 1,770,340
1,493,690 1,482,658
Mortgage banking operations 173,320
142,894
Interchange 549,074
514,196 475,810
Other 294,361
262,142 306,224
Total non-interest income 6,996,732
6,358,105 5,900,157
Non-Interest Expense:
Salaries and associate benefits 2,239,468
1,749,738 1,642,721
Marketing 1,444,635
1,379,938 1,337,780
Communications and data processing 713,439
580,992 475,355
Supplies and equipment 460,680
355,734 349,920
Occupancy 218,265
152,090 206,614
Other 1,890,706
1,499,781 1,309,829
Total non-interest expense 6,967,193
5,718,273 5,322,219
Income before income taxes 3,652,731
2,829,002 2,360,064
Income taxes 1,238,238
1,019,855 816,582
Net income $ 2,414,493 $ 1,809,147 $ 1,543,482
Basic earnings per share $ 7.80
$ 6.98 $ 6.55
Diluted earnings per share $ 7.62
$ 6.73 $ 6.21
Dividends paid per share $ 0.11
$ 0.11 $ 0.11
See Notes to Consolidated Financial Statements.