Capital One 2006 Annual Report Download - page 127
Download and view the complete annual report
Please find page 127 of the 2006 Capital One annual report below. You can navigate through the pages in the report by either clicking on the pages listed below, or by using the keyword search tool below to find specific information within the annual report.-
 1
1 -
2
-
3
-
4
-
5
-
6
-
7
-
8
-
9
-
10
-
11
-
12
-
13
-
14
-
15
-
16
-
17
-
18
-
19
-
20
-
21
-
22
-
23
-
24
-
25
-
26
-
27
-
28
-
29
-
30
-
31
-
32
-
33
-
34
-
35
-
36
-
37
-
38
-
39
-
40
-
41
-
42
-
43
-
44
-
45
-
46
-
47
-
48
-
49
-
50
-
51
-
52
-
53
-
54
-
55
-
56
-
57
-
58
-
59
-
60
-
61
-
62
-
63
-
64
-
65
-
66
-
67
-
68
-
69
-
70
-
71
-
72
-
73
-
74
-
75
-
76
-
77
-
78
-
79
-
80
-
81
-
82
-
83
-
84
-
85
-
86
-
87
-
88
-
89
-
90
-
91
-
92
-
93
-
94
-
95
-
96
-
97
-
98
-
99
-
100
-
101
-
102
-
103
-
104
-
105
-
106
-
107
-
108
-
109
-
110
-
111
-
112
-
113
-
114
-
115
-
116
-
 117
117 -
 118
118 -
 119
119 -
 120
120 -
 121
121 -
 122
122 -
 123
123 -
 124
124 -
 125
125 -
 126
126 -
 127
127 -
 128
128 -
 129
129 -
 130
130 -
 131
131 -
 132
132 -
 133
133 -
 134
134 -
 135
135 -
 136
136 -
 137
137 -
138
-
139
-
140
-
141
-
142
-
143
-
144
-
145
-
146
-
147
-
148
 |
 |

109
commitments and the related hedging instruments are recorded at fair value with changes in fair value recorded in current
earnings as a component of gain on sale of loans.
Generally, if interest rates increase, the value of the interest rate lock commitments and funded loans decrease and loan sale
margins are adversely impacted. The Company economically hedges the risk of overall changes in fair value of loans held-
for-sale and interest rate lock commitments generally by entering into mandatory commitments to deliver mortgage whole
loans to various investors, selling forward contracts on government backed mortgage securities and, to a lesser extent, by
using futures and options to economically hedge the fair value of interest rate lock commitments. In accordance with
SFAS 133, certain of these positions qualify as fair value hedges against a portion of the funded held-for-sale loan portfolio
and result in adjustments to the carrying value of designated loans through gain on sale based on fair value changes
attributable to the hedged risk. The forward contracts, futures and options used to economically hedge the loan commitments
are accounted for as non-trading derivatives and naturally offset loan commitment mark-to-market gains and losses
recognized as a component of gain on sale. During the month ended December 31, 2006, the Company had immaterial net
gains related to its mortgage banking non-trading derivatives.
The notional amount of all forward contracts was $3.4 billion at December 31, 2006. Forward contracts designated as fair
value hedges associated with mortgage loans held-for-sale had a notional value of $2.6 billion at December 31, 2006. The
notional amount of forward contracts used to manage the risk associated with interest rate lock commitments on mortgage
loans was $0.8 billion at December 31, 2006.
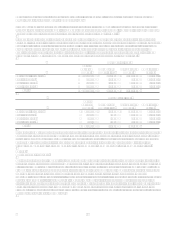
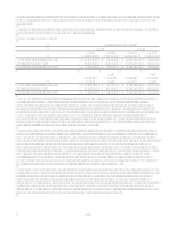
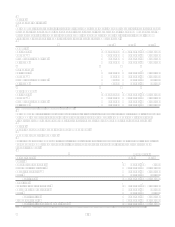
The following table shows hedge ineffectiveness on fair value hedges included in gain on sale of loans for the month and
year ended December 31, 2006:
2006
Gain/(Loss) on Hedged Mortgage Loans (4,031)
Gain/(Loss) on Derivatives 4,015
Hedge Ineffectiveness (16)
Note 24
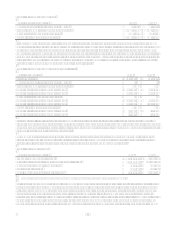
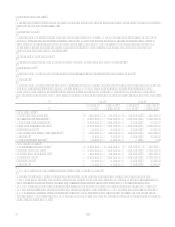
Significant Concentration of Credit Risk
The Company is active in originating loans in the United States and internationally. International loans are originated
primarily in Canada and the United Kingdom. The Company reviews each potential customers credit application and
evaluates the applicants financial history and ability and willingness to repay. Loans are made on an unsecured and secured
basis. Certain commercial, small business, mortgage and automobile loans require collateral in various forms including cash
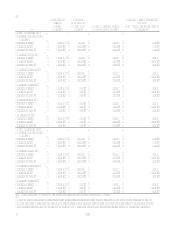
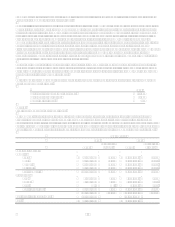
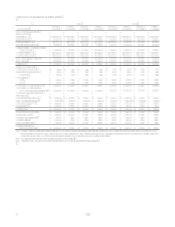
deposits, automobiles and real estate, as appropriate. The geographic distribution of the Companys loans was as follows:
December 31
2006 2005
Loans
Percentage
of Total Loans
Percentage
of Total
Geographic Region:
Domestic
South $ 49,604,219 33.94% $ 44,959,029 42.60%
West 24,897,404 17.04% 18,225,986 17.27
Midwest 20,179,405 13.81% 17,091,800 16.20
Northeast 39,722,822 27.18% 14,601,852 13.84
Total Domestic 134,403,850 91.97% 94,878,667 89.91%
International
U.K. 8,964,525 6.13% 8,124,850 7.70%
Canada 2,782,893 1.90% 2,513,936 2.38
Other 10,038 0.01
Total International 11,747,418 8.03% 10,648,824 10.09%
146,151,268 100.00% 105,527,491 100.00%
Less securitization adjustments (49,639,129) (45,679,810)
Total $ 96,512,139
$ 59,847,681