Capital One 2006 Annual Report Download - page 74
Download and view the complete annual report
Please find page 74 of the 2006 Capital One annual report below. You can navigate through the pages in the report by either clicking on the pages listed below, or by using the keyword search tool below to find specific information within the annual report.-
 1
1 -
2
-
3
-
4
-
5
-
6
-
7
-
8
-
9
-
10
-
11
-
12
-
13
-
14
-
15
-
16
-
17
-
18
-
19
-
20
-
21
-
22
-
23
-
24
-
25
-
26
-
27
-
28
-
29
-
30
-
31
-
32
-
33
-
34
-
35
-
36
-
37
-
38
-
39
-
40
-
41
-
42
-
43
-
44
-
45
-
46
-
47
-
48
-
49
-
50
-
51
-
52
-
53
-
54
-
55
-
56
-
57
-
58
-
59
-
60
-
61
-
62
-
63
-
 64
64 -
 65
65 -
 66
66 -
 67
67 -
 68
68 -
 69
69 -
 70
70 -
 71
71 -
 72
72 -
 73
73 -
 74
74 -
 75
75 -
 76
76 -
 77
77 -
 78
78 -
 79
79 -
 80
80 -
 81
81 -
 82
82 -
 83
83 -
 84
84 -
85
-
86
-
87
-
88
-
89
-
90
-
91
-
92
-
93
-
94
-
95
-
96
-
97
-
98
-
99
-
100
-
101
-
102
-
103
-
104
-
105
-
106
-
107
-
108
-
109
-
110
-
111
-
112
-
113
-
114
-
115
-
116
-
117
-
118
-
119
-
120
-
121
-
122
-
123
-
124
-
125
-
126
-
127
-
128
-
129
-
130
-
131
-
132
-
133
-
134
-
135
-
136
-
137
-
138
-
139
-
140
-
141
-
142
-
143
-
144
-
145
-
146
-
147
-
148
 |
 |

56
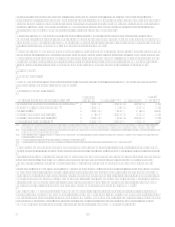
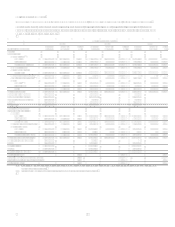
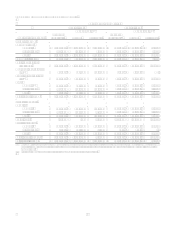
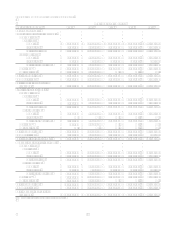
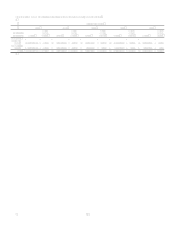
XII. Tabular Summary
TABLE ASTATEMENTS OF AVERAGE BALANCES, INCOME AND EXPENSE, YIELDS AND RATES
Table A provides average balance sheet data and an analysis of net interest income, net interest spread (the difference
between the yield on earning assets and the cost of interest-bearing liabilities) and net interest margin for the years ended
December 31, 2006, 2005 and 2004.
Year Ended December 31
2006 2005 2004
(Dollars in Thousands)
Average
Balance
Income/
Expense
Yield/
Rate
Average
Balance
Income/
Expense
Yield/
Rate
Average
Balance
Income/
Expense
Yield
/
Rate
Assets:
Earning assets
Consumer loans(1)
Domestic $ 47,427,119 $ 5,986,533 12.62% $ 31,891,276 $ 4,226,617 13.25% $ 27,376,799 $ 3,614,142 13.20%
International 3,842,113 433,126 11.27% 4,083,531 452,652 11.08% 3,539,760 390,384 11.03%
Total consumer loans 51,269,232 6,419,659 12.52% 35,974,807 4,679,269 13.01% 30,916,559 4,004,526 12.95%
Commercial loans 12,308,047 626,814 5.09% 4,759,430 331,570 6.97% 3,349,109 229,894 6.86%
Total Loans Held for
Investment 63,577,279 7,046,473 11.08% 40,734,237 5,010,839 12.30% 34,265,668 4,234,420 12.36%
Mortgage loans held for sale(2) 1,056,937 71,063 6.72% 39,415 8,799 22.32%
Securities available for sale(2) 14,686,556 676,712 4.61% 10,085,562 386,896 3.84% 8,876,233 312,301 3.52%
Other
Domestic(2) 4,094,556 349,782 8.54% 3,270,241 241,162 7.37% 2,580,955 192,974 7.48%
International 1,106,527 50,199 4.54% 1,407,559 79,185 5.63% 932,813 54,725 5.87%
Total 5,201,083 399,981 7.69% 4,677,800 320,347 6.85% 3,513,768 247,699 7.05%
Total earning assets 84,521,855 $ 8,194,229 9.69% 55,537,014 $ 5,726,881 10.32% 46,655,669 $ 4,794,420 10.28%
Cash and due from banks 1,685,152 1,000,240 506,483
Allowance for loan losses (1,791,172) (1,482,948 ) (1,473,003
Premises and equipment, net 1,474,882 842,368 874,960
Other(2) 9,919,042
5,463,826
4,083,943
Total assets $ 95,809,759
$ 61,360,500
$ 50,648,052
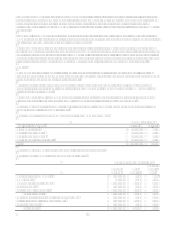
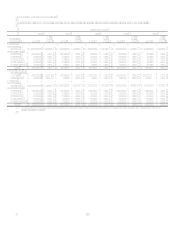
Liabilities and Equity:
Interest-bearing liabilities
Deposits
Domestic $ 43,409,416 $ 1,700,986 3.92% $ 25,838,996 $ 1,043,211 4.04% $ 22,517,293 $ 916,343 4.07%
International 2,329,611 113,811 4.89% 2,531,739 129,926 5.13% 1,795,996 93,202 5.19%
Total Deposits 45,739,027 1,814,797 3.97% 28,370,735 1,173,137 4.14% 24,313,289 1,009,545 4.15%
Senior and subordinated notes 6,820,615 411,643 6.04% 6,820,811 421,218 6.18% 7,203,423 486,812 6.76%
Other borrowings
Domestic 16,787,936 857,977 5.11% 11,195,697 451,725 4.03% 8,518,817 295,029 3.46%
International 1,115,981 10,182 0.91% 15,441 559 3.62% 1,360 56 4.12%
Total other borrowings 17,903,917 868,159 4.85% 11,211,138 452,284 4.03% 8,520,177 295,085 3.46%
Total interest-bearing liabilities 70,463,559 $ 3,094,599 4.39% 46,402,684 $ 2,046,639 4.41% 40,036,889 $ 1,791,442 4.47%
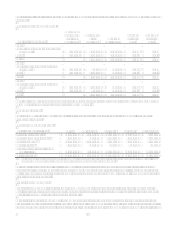
Non-interest bearing deposits 4,934,407 648,917
Other 4,208,371
3,714,631
3,315,616
Total liabilities 79,606,337 50,766,232 43,352,505
Equity 16,203,422
10,594,268
7,295,547
Total liabilities and equity $ 95,809,759
$ 61,360,500
$ 50,648,052
Net interest spread 5.30% 5.91% 5.81%
Interest income to average earning assets 9.69% 10.32% 10.28%
Interest expense to average earning assets 3.66% 3.69% 3.84%
Net interest margin 6.03% 6.63% 6.44%
(1) Interest income includes past-due fees on loans of approximately $699.5 million, $776.5 million and $792.0 million for the years ended December 31, 2006,
2005 and 2004, respectively.
(2) Prior period amounts have been reclassified to conform with current period presentation.