Capital One 2006 Annual Report Download - page 14
Download and view the complete annual report
Please find page 14 of the 2006 Capital One annual report below. You can navigate through the pages in the report by either clicking on the pages listed below, or by using the keyword search tool below to find specific information within the annual report.-
 1
1 -
2
-
3
-
 4
4 -
 5
5 -
 6
6 -
 7
7 -
 8
8 -
 9
9 -
 10
10 -
 11
11 -
 12
12 -
 13
13 -
 14
14 -
 15
15 -
 16
16 -
 17
17 -
 18
18 -
 19
19 -
 20
20 -
 21
21 -
 22
22 -
 23
23 -
 24
24 -
25
-
26
-
27
-
28
-
29
-
30
-
31
-
32
-
33
-
34
-
35
-
36
-
37
-
38
-
39
-
40
-
41
-
42
-
43
-
44
-
45
-
46
-
47
-
48
-
49
-
50
-
51
-
52
-
53
-
54
-
55
-
56
-
57
-
58
-
59
-
60
-
61
-
62
-
63
-
64
-
65
-
66
-
67
-
68
-
69
-
70
-
71
-
72
-
73
-
74
-
75
-
76
-
77
-
78
-
79
-
80
-
81
-
82
-
83
-
84
-
85
-
86
-
87
-
88
-
89
-
90
-
91
-
92
-
93
-
94
-
95
-
96
-
97
-
98
-
99
-
100
-
101
-
102
-
103
-
104
-
105
-
106
-
107
-
108
-
109
-
110
-
111
-
112
-
113
-
114
-
115
-
116
-
117
-
118
-
119
-
120
-
121
-
122
-
123
-
124
-
125
-
126
-
127
-
128
-
129
-
130
-
131
-
132
-
133
-
134
-
135
-
136
-
137
-
138
-
139
-
140
-
141
-
142
-
143
-
144
-
145
-
146
-
147
-
148
 |
 |
12
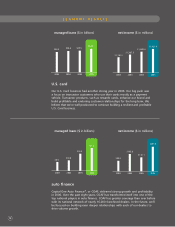
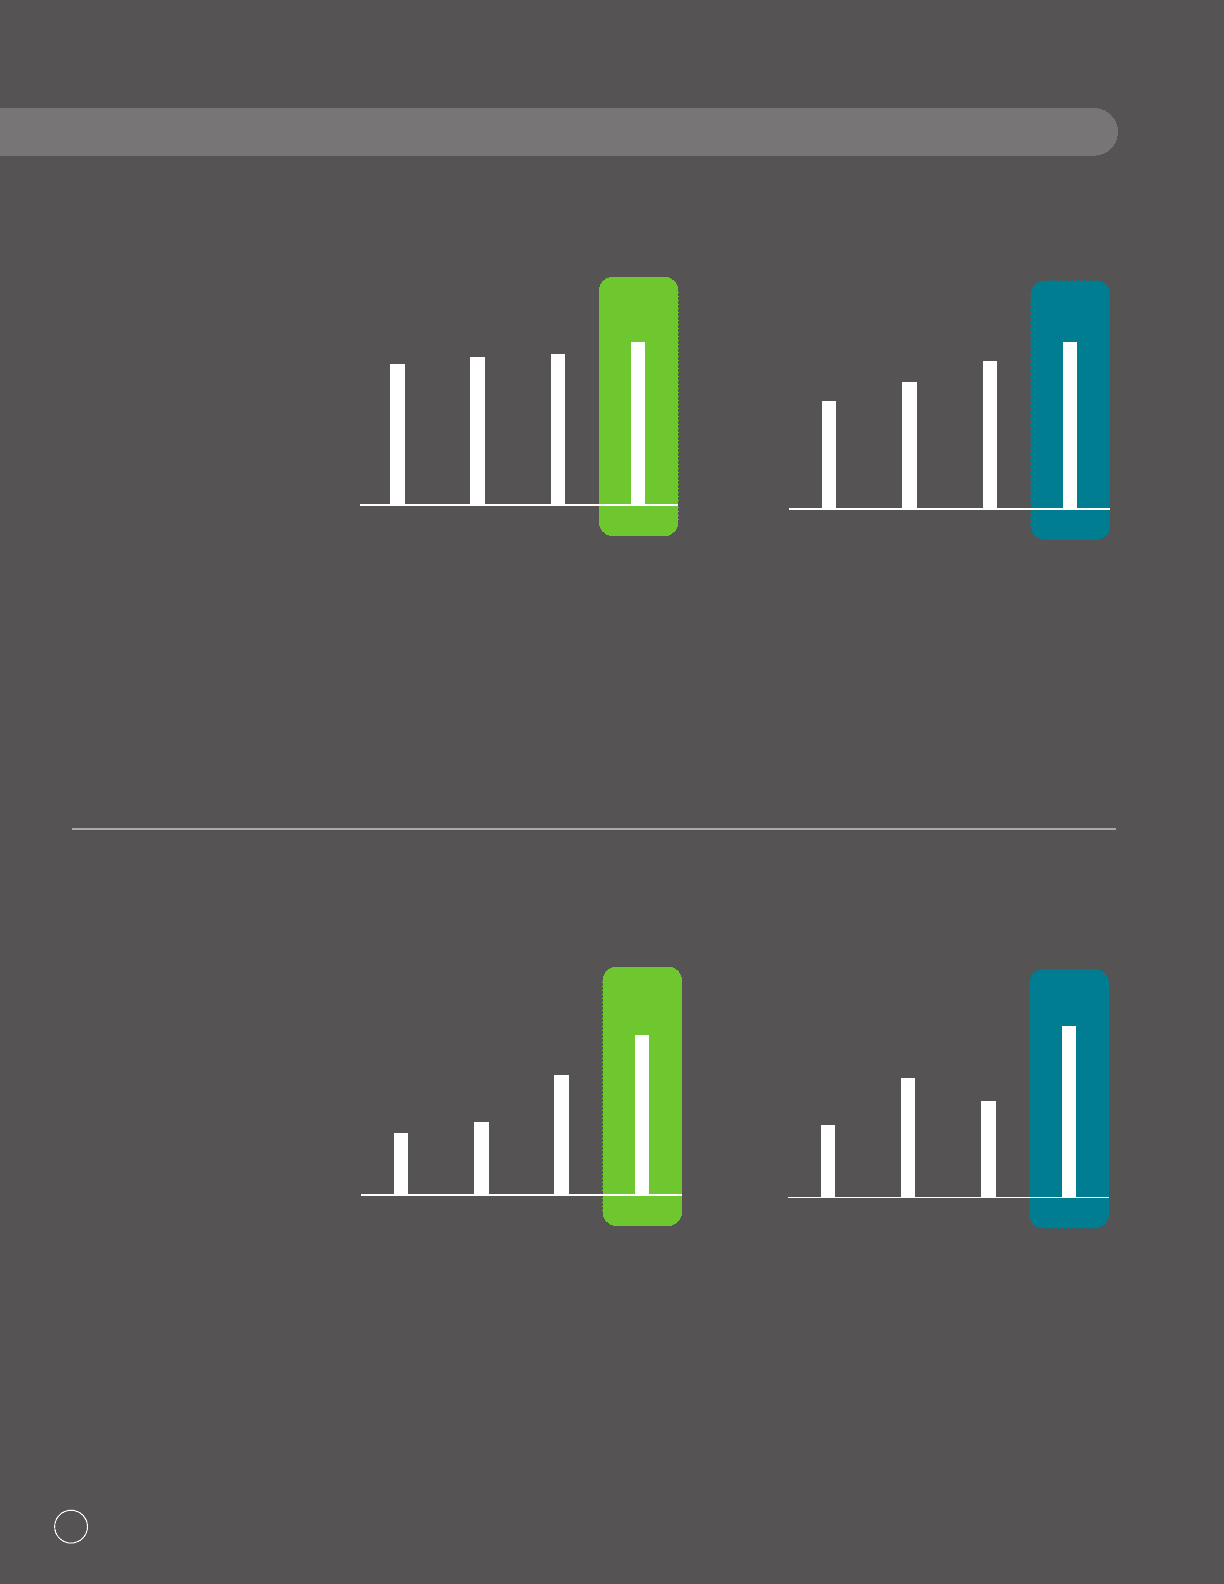
U.S. card
Our U.S. Card business had another strong year in 2006. Our big push was
afocus on transactor customers who use their cards mostly as a payment
vehicle. Transactor products, such as rewards cards, enhance our brand and
build profitable and enduring customer relationships for the long term. We
believe that we’re well-positioned to continue building a resilient and profitable
U.S. Card business.
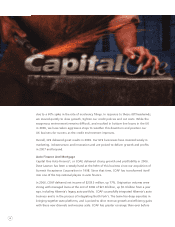
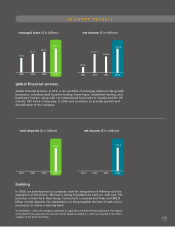
auto finance
Capital One Auto Finance®,or COAF, delivered strong growth and profitability
in 2006. Over the past eight years, COAF has transformed itself into one of the
top national players in auto finance. COAF has greater coverage than ever before
with its national network of nearly 16,000 franchised dealers. In the future, we’ll
be focused on building even deeper relationships with each of our dealers to
drive volume growth.
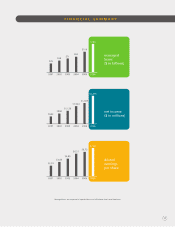
managed loans ($ in billions) net income ($ in millions)
managed loans ($ in billions) net income ($ in millions)
2006200520042003
$46.3 $48.6 $49.5 $53.6
2006200520042003
$1,181.2
$1,387.3
$1,609.4
$1,823.4
2006200520042003
$8.5 $10.0
$16.4
$21.8
2006200520042003
$99.3
$163.8
$132.1
$233.5
SEGMENT RESULTS