Capital One 2006 Annual Report Download - page 84
Download and view the complete annual report
Please find page 84 of the 2006 Capital One annual report below. You can navigate through the pages in the report by either clicking on the pages listed below, or by using the keyword search tool below to find specific information within the annual report.-
 1
1 -
2
-
3
-
4
-
5
-
6
-
7
-
8
-
9
-
10
-
11
-
12
-
13
-
14
-
15
-
16
-
17
-
18
-
19
-
20
-
21
-
22
-
23
-
24
-
25
-
26
-
27
-
28
-
29
-
30
-
31
-
32
-
33
-
34
-
35
-
36
-
37
-
38
-
39
-
40
-
41
-
42
-
43
-
44
-
45
-
46
-
47
-
48
-
49
-
50
-
51
-
52
-
53
-
54
-
55
-
56
-
57
-
58
-
59
-
60
-
61
-
62
-
63
-
64
-
65
-
66
-
67
-
68
-
69
-
70
-
71
-
72
-
73
-
 74
74 -
 75
75 -
 76
76 -
 77
77 -
 78
78 -
 79
79 -
 80
80 -
 81
81 -
 82
82 -
 83
83 -
 84
84 -
 85
85 -
 86
86 -
 87
87 -
 88
88 -
 89
89 -
 90
90 -
 91
91 -
 92
92 -
 93
93 -
 94
94 -
95
-
96
-
97
-
98
-
99
-
100
-
101
-
102
-
103
-
104
-
105
-
106
-
107
-
108
-
109
-
110
-
111
-
112
-
113
-
114
-
115
-
116
-
117
-
118
-
119
-
120
-
121
-
122
-
123
-
124
-
125
-
126
-
127
-
128
-
129
-
130
-
131
-
132
-
133
-
134
-
135
-
136
-
137
-
138
-
139
-
140
-
141
-
142
-
143
-
144
-
145
-
146
-
147
-
148
 |
 |

66
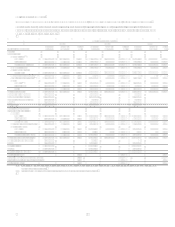
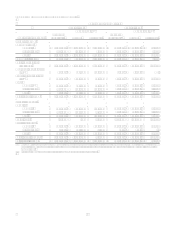
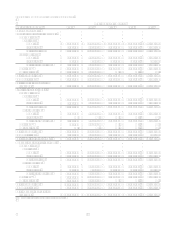
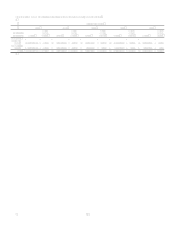
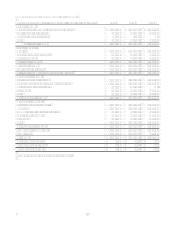
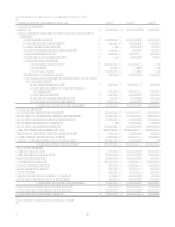
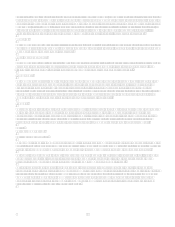
Item 8. Financial Statements and Supplementary Data
CONSOLIDATED BALANCE SHEETS
December 31 (In Thousands, Except Share and Per Share Data) 2006 2005
Assets:
Cash and due from banks $ 2,817,519 $ 2,022,175
Federal funds sold and resale agreements 1,099,156 1,305,537
Interest-bearing deposits at other banks 743,821 743,555
Cash and cash equivalents 4,660,496 4,071,267
Securities available for sale 15,452,047 14,245,018
Mortgage loans held for sale 10,435,295 197,444
Loans held for investment 96,512,139 59,847,681
Less: Allowance for loan and lease losses (2,180,000) (1,790,000)
Net loans held for investment 94,332,139 58,057,681
Accounts receivable from securitizations 4,589,235 4,904,547
Premises and equipment, net 2,203,280 1,191,406
Interest receivable 816,426 563,542
Goodwill 13,635,435 3,906,399
Other 3,614,932 1,564,107
Total assets $ 149,739,285 $ 88,701,411
Liabilities:
Non-interest bearing deposits $ 11,648,070 $ 4,841,171
Interest-bearing deposits 74,122,822 43,092,096
Total deposits 85,770,892 47,933,267
Senior and subordinated notes 9,725,470 6,743,979
Other borrowings 24,257,007 15,534,161
Interest payable 574,763 371,681
Other 4,175,947 3,989,409
Total liabilities 124,504,079 74,572,497
Stockholders Equity:
Preferred stock, par value $.01 per share; authorized 50,000,000 shares, none issued or
outstanding
Common stock, par value $.01 per share; authorized 1,000,000,000 shares, 412,219,973
and 302,786,444 issued as of December 31, 2006 and 2005, respectively 4,122 3,028
Paid-in capital, net 15,333,137 6,848,544
Retained earnings 9,760,184 7,378,015
Cumulative other comprehensive income 266,180 6,129
Less: Treasury stock, at cost; 2,294,586 and 2,025,160 shares as of December 31,
2006 and 2005, respectively (128,417) (106,802)
Total stockholders equity 25,235,206 14,128,914
Total liabilities and stockholders equity $ 149,739,285 $ 88,701,411
See Notes to Consolidated Financial Statements.