Capital One 2006 Annual Report Download - page 62
Download and view the complete annual report
Please find page 62 of the 2006 Capital One annual report below. You can navigate through the pages in the report by either clicking on the pages listed below, or by using the keyword search tool below to find specific information within the annual report.-
 1
1 -
2
-
3
-
4
-
5
-
6
-
7
-
8
-
9
-
10
-
11
-
12
-
13
-
14
-
15
-
16
-
17
-
18
-
19
-
20
-
21
-
22
-
23
-
24
-
25
-
26
-
27
-
28
-
29
-
30
-
31
-
32
-
33
-
34
-
35
-
36
-
37
-
38
-
39
-
40
-
41
-
42
-
43
-
44
-
45
-
46
-
47
-
48
-
49
-
50
-
51
-
 52
52 -
 53
53 -
 54
54 -
 55
55 -
 56
56 -
 57
57 -
 58
58 -
 59
59 -
 60
60 -
 61
61 -
 62
62 -
 63
63 -
 64
64 -
 65
65 -
 66
66 -
 67
67 -
 68
68 -
 69
69 -
 70
70 -
 71
71 -
 72
72 -
73
-
74
-
75
-
76
-
77
-
78
-
79
-
80
-
81
-
82
-
83
-
84
-
85
-
86
-
87
-
88
-
89
-
90
-
91
-
92
-
93
-
94
-
95
-
96
-
97
-
98
-
99
-
100
-
101
-
102
-
103
-
104
-
105
-
106
-
107
-
108
-
109
-
110
-
111
-
112
-
113
-
114
-
115
-
116
-
117
-
118
-
119
-
120
-
121
-
122
-
123
-
124
-
125
-
126
-
127
-
128
-
129
-
130
-
131
-
132
-
133
-
134
-
135
-
136
-
137
-
138
-
139
-
140
-
141
-
142
-
143
-
144
-
145
-
146
-
147
-
148
 |
 |

44
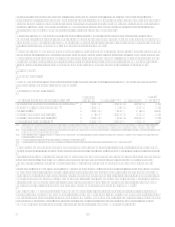
Global Financial Services Segment
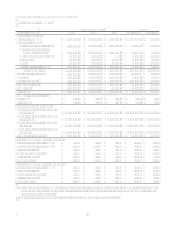
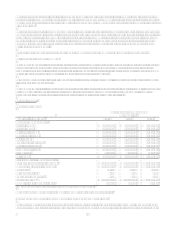
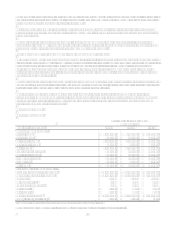
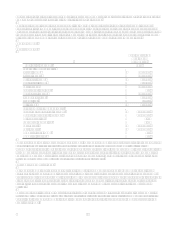
Table 4: Global Financial Services
As of and for the Year Ended
December 31,
(Dollars in thousands) 2006 2005 2004
Earnings (Managed Basis)
Interest income $ 2,979,164 $ 2,619,251 $ 2,181,169
Interest expense 1,161,293 938,729 759,661
Net interest income 1,817,871 1,680,522 1,421,508
Non-interest income 1,187,087 1,022,756 844,192
Total revenue 3,004,958 2,703,278 2,265,700
Provision for loan losses 1,068,395 925,777 683,612
Non-interest expense 1,509,666 1,496,678 1,265,549
Income before taxes 426,897 280,823 316,539
Income taxes 152,945 94,796 103,459
Net income $ 273,952 $ 186,027 $ 213,080
Selected Metrics (Managed Basis)
Period end loans held for investment $ 26,983,673 $ 23,386,490 $ 21,240,325
Average loans held for investment $ 25,421,248 $ 22,212,680 $ 18,639,180
Loan Yield 11.65% 11.76% 11.70%
Net charge-off rate 3.78% 3.97% 3.39%
30+ day delinquency rate 2.97% 2.83% 2.81%
Core deposits $ N/A N/A
Total deposits $ 2,377,841 N/A N/A
Number of Accounts (000s) 10,155 9,928 9,175
The Global Financial Services segment consists of international (UK and Canada) lending, small business lending,
installment loans, home loans, healthcare finance and other consumer financial service activities, extending Capital Ones
national scale lending franchise and providing geographic diversification. Global Financial Services represents a growing
earnings contributor for the Company with a greater than 60% compound annual growth rate since 2003.
Year Ended December 31, 2006 Compared to Year Ended December 31, 2005
Global Financial Services net income increased 47% for the year ended December 31, 2006 as a result of strong growth and
profitability across all North American businesses. Strong 2006 growth in North America was offset by challenges in Europe.
Total revenue increased 11% for the year ended December 31, 2006, slightly below the 14% growth in average loans for the
same period.
The provision for loan losses increased 15% for the year ended December 31, 2006, as a result of growth in the loan portfolio
combined with deteriorating credit quality metrics in the U.K. during 2006. Global Financial Services net charge-off rate
declined 19 basis points for 2006 compared to the prior year. The decrease in the net charge-off rate is largely the result of
the 2005 U.S. bankruptcy legislation changes and continued stability in North American credit quality trends, offset by
continued worsening in the U.K.
Non-interest expense increased 1% for the year ended December 31, 2006. Non-interest expense in 2005 included a $28.2
million impairment charge related to the write-off of goodwill and other charges related to the Companys insurance
brokerage business. Exclusive of the one time charge, non-interest expense increased 3% for the year ended December 31,
2006, well below the growth in revenue of 11% and average loans of 14%.
Year Ended December 31, 2005 Compared to Year Ended December 31, 2004
Global Financial Services segments loan portfolio increased 10% year over year as a result of the underlying performance of
our North American businesses.
Global Financial Services net income decreased 13% for the year ended December 31, 2005 as a result of increases in
provision for loan losses and non-interest expense and one-time gains on the sales of the Companys joint venture investment
in South Africa and French loan portfolio that occurred during 2004, offset by increases in revenue. Total revenue increased
19% for the year ended December 31, 2005 as a result of a 19% growth in average loans for the same period and
contributions from the Global Financial Services businesses acquired in 2005.