Capital One 2006 Annual Report Download - page 123
Download and view the complete annual report
Please find page 123 of the 2006 Capital One annual report below. You can navigate through the pages in the report by either clicking on the pages listed below, or by using the keyword search tool below to find specific information within the annual report.-
 1
1 -
2
-
3
-
4
-
5
-
6
-
7
-
8
-
9
-
10
-
11
-
12
-
13
-
14
-
15
-
16
-
17
-
18
-
19
-
20
-
21
-
22
-
23
-
24
-
25
-
26
-
27
-
28
-
29
-
30
-
31
-
32
-
33
-
34
-
35
-
36
-
37
-
38
-
39
-
40
-
41
-
42
-
43
-
44
-
45
-
46
-
47
-
48
-
49
-
50
-
51
-
52
-
53
-
54
-
55
-
56
-
57
-
58
-
59
-
60
-
61
-
62
-
63
-
64
-
65
-
66
-
67
-
68
-
69
-
70
-
71
-
72
-
73
-
74
-
75
-
76
-
77
-
78
-
79
-
80
-
81
-
82
-
83
-
84
-
85
-
86
-
87
-
88
-
89
-
90
-
91
-
92
-
93
-
94
-
95
-
96
-
97
-
98
-
99
-
100
-
101
-
102
-
103
-
104
-
105
-
106
-
107
-
108
-
109
-
110
-
111
-
112
-
 113
113 -
 114
114 -
 115
115 -
 116
116 -
 117
117 -
 118
118 -
 119
119 -
 120
120 -
 121
121 -
 122
122 -
 123
123 -
 124
124 -
 125
125 -
 126
126 -
 127
127 -
 128
128 -
 129
129 -
 130
130 -
 131
131 -
 132
132 -
 133
133 -
134
-
135
-
136
-
137
-
138
-
139
-
140
-
141
-
142
-
143
-
144
-
145
-
146
-
147
-
148
 |
 |

105
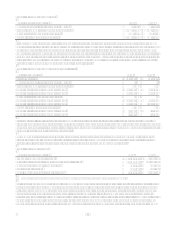
undivided interests fluctuate as the accountholders make principal payments and incur new charges on the selected accounts.
The amount of retained consumer loan receivables was $9.9 billion and $11.0 billion as of December 31, 2006 and 2005,
respectively.
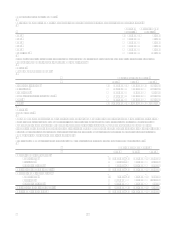
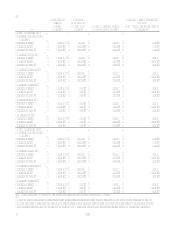
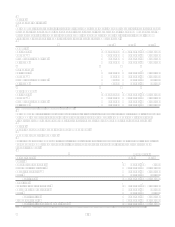
The following table presents the year-end and average balances, as well as the delinquent and net charge-off amounts of the
reported, off-balance sheet and managed consumer loan portfolios.
Supplemental Loan Information
Year Ended December 31
2006 2005
Loans
Outstanding
Loans
Delinquent
Loans
Outstanding
Loans
Delinquent
Managed loans held for investment $ 146,151,268 $ 4,414,045
$ 105,527,491 $ 3,423,820
Securitization adjustments (49,639,129) (1,765,642) (45,679,810) (1,544,812)
Reported loans held for investment $ 96,512,139 $ 2,648,403
$ 59,847,681 $ 1,879,008
Average
Loans
Net
Charge-
Offs
Average
Loans
Net
Charge-
Offs
Managed loans held for investment $ 111,328,595 $ 3,158,080
$ 85,265,023 $ 3,623,152
Securitization adjustments (47,751,316) (1,750,591) (44,530,786) (2,176,503)
Reported loans held for investment $ 63,577,279 $ 1,407,489
$ 40,734,237 $ 1,446,649
The Companys retained residual interests in the off-balance sheet securitizations are recorded in accounts receivable from
securitizations and are comprised of interest-only strips, retained subordinated undivided interests in the transferred
receivables, cash collateral accounts, cash reserve accounts and unpaid interest and fees on the investors portion of the
transferred principal receivables. The interest-only strip is recorded at fair value, while the majority of the other residual
interests are carried at cost, which approximates fair value. Retained residual interests totaled $2.2 billion and $2.4 billion at
December 31, 2006 and 2005, respectively. The Companys retained residual interests are generally restricted or
subordinated to investors interests and their value is subject to substantial credit, repayment and interest rate risks on the
transferred financial assets. The investors and the trusts have no recourse to the Companys assets, other than the retained
residual interests, if the off-balance sheet loans are not paid when due.
The gain on sale recorded from off-balance sheet securitizations is based on the estimated fair value of the assets sold and
retained and liabilities incurred, and is recorded at the time of sale, net of transaction costs, in servicing and securitizations
income on the Consolidated Statements of Income. The related receivable is the interest-only strip, which is based on the
present value of the estimated future cash flows from excess finance charges and past-due fees over the sum of the return paid
to security holders, estimated contractual servicing fees and credit losses. The Company periodically reviews the key
assumptions and estimates used in determining the value of the interest-only strip. The Company recognizes all changes in
the fair value of the interest-only strip immediately in servicing and securitizations income on the consolidated statements of
income in accordance with the provisions of SFAS No. 115, Accounting for Certain Investments in Debt and Equity
Securities. In accordance with Emerging Issues Task Force 99-20 (EITF 99-20), Recognition of Interest Income and
Impairment of Purchased and Retained Beneficial Interests in Securitized Financial Assets, the interest component of cash
flows attributable to retained interests in securitizations is recorded in other interest income.
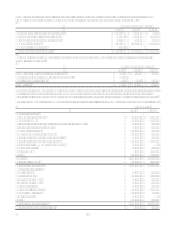
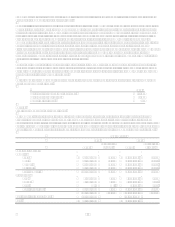
The key assumptions used in determining the fair value of the interest-only strips resulting from securitizations of consumer
loan receivables completed during the period included the weighted average ranges for charge-off rates, principal repayment
rates, lives of receivables and discount rates included in the following table. The charge-off rates are determined using
forecasted net charge-offs expected for the trust calculated consistently with other company charge-off forecasts. The
principal repayment rate assumptions are determined using actual and forecasted trust principal repayment rates based on the
collateral. The lives of receivables are determined as the number of months necessary to pay off the investors given the
principal repayment rate assumptions. The discount rates are determined using primarily trust specific statistics and forward
rate curves, and are reflective of what market participants would use in a similar valuation.