Capital One 2006 Annual Report Download - page 97
Download and view the complete annual report
Please find page 97 of the 2006 Capital One annual report below. You can navigate through the pages in the report by either clicking on the pages listed below, or by using the keyword search tool below to find specific information within the annual report.-
 1
1 -
2
-
3
-
4
-
5
-
6
-
7
-
8
-
9
-
10
-
11
-
12
-
13
-
14
-
15
-
16
-
17
-
18
-
19
-
20
-
21
-
22
-
23
-
24
-
25
-
26
-
27
-
28
-
29
-
30
-
31
-
32
-
33
-
34
-
35
-
36
-
37
-
38
-
39
-
40
-
41
-
42
-
43
-
44
-
45
-
46
-
47
-
48
-
49
-
50
-
51
-
52
-
53
-
54
-
55
-
56
-
57
-
58
-
59
-
60
-
61
-
62
-
63
-
64
-
65
-
66
-
67
-
68
-
69
-
70
-
71
-
72
-
73
-
74
-
75
-
76
-
77
-
78
-
79
-
80
-
81
-
82
-
83
-
84
-
85
-
86
-
 87
87 -
 88
88 -
 89
89 -
 90
90 -
 91
91 -
 92
92 -
 93
93 -
 94
94 -
 95
95 -
 96
96 -
 97
97 -
 98
98 -
 99
99 -
 100
100 -
 101
101 -
 102
102 -
 103
103 -
 104
104 -
 105
105 -
 106
106 -
 107
107 -
108
-
109
-
110
-
111
-
112
-
113
-
114
-
115
-
116
-
117
-
118
-
119
-
120
-
121
-
122
-
123
-
124
-
125
-
126
-
127
-
128
-
129
-
130
-
131
-
132
-
133
-
134
-
135
-
136
-
137
-
138
-
139
-
140
-
141
-
142
-
143
-
144
-
145
-
146
-
147
-
148
 |
 |

79
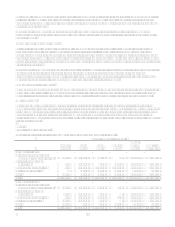
businesses not included in the reportable segments, the mortgage and banking business recently added through the acquisition
of North Fork Bancorporation, investments in external companies, and various non-lending activities. The Other category
also includes the net impact of transfer pricing, certain unallocated expenses and gains/losses related to the securitization of
assets.
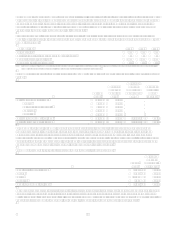
As management makes decisions on a managed basis within each segment, information about reportable segments is
provided on a managed basis. An adjustment to reconcile the managed financial information to the reported financial
information in the consolidated financial statements is provided. This adjustment reclassifies a portion of net interest income,
non-interest income and provision for loan losses into non-interest income from servicing and securitizations.
The Company maintains its books and records on a legal entity basis for the preparation of financial statements in conformity
with GAAP. The following tables present information prepared from the Companys internal management information
system, which is maintained on a line of business level through allocations from the consolidated financial results.
See Note 1, Significant Accounting Policies, for the accounting policies of the reportable segments.
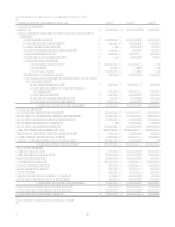
Year Ended December 31, 2006
U.S. Card Auto
Finance
Global
Financial
Services Banking Other Total
Managed Securitization
Adjustments(1)
Total
Reported
Net interest
income $ 4,715,798 $ 1,437,795 $ 1,817,871 $ 996,929 $ (27,517) $ 8,940,876 $ (3,841,246) $ 5,099,630
Non-interest
income 3,255,681 16,106 1,187,087 446,071 (1,955) 4,902,990 2,093,742 6,996,732
Provision for
loan losses 1,644,619 494,835 1,068,395 399 15,694 3,223,942 (1,747,504) 1,476,438
Non-interest
expenses 3,521,627 599,807 1,509,666 1,167,873 168,220 6,967,193 6,967,193
Income tax
provision
(benefit) 981,833 125,740 152,945 96,155 (118,435) 1,238,238 1,238,238
Net income
(loss) $ 1,823,400 $ 233,519 $ 273,952 $ 178,573 $ (94,951) $ 2,414,493 $ $ 2,414,493
Loans held for
investment $ 53,623,680 $ 21,751,827 $ 26,983,673 $ 12,145,533 $ 31,646,555 $ 146,151,268 $ (49,639,129) $ 96,512,139
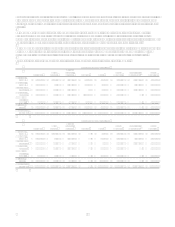
Year Ended December 31, 2005
U.S. Card Auto
Finance
Global
Financial
Services Banking Other Total
Managed Securitization
Adjustments(1)
Total
Reported
Net interest
income $ 4,793,956 $ 1,149,377 $ 1,680,522 $ $ 31,599 $ 7,655,454 $ (3,975,212) $ 3,680,242
Non-interest
income 3,321,457 19,951 1,022,756 195,234 4,559,398 1,798,707 6,358,105
Provision for
loan losses 2,279,109 459,513 925,777 3,178 3,667,577 (2,176,505) 1,491,072
Non-interest
expenses 3,356,600 506,480 1,496,678 358,515 5,718,273 5,718,273
Income tax
provision
(benefit) 870,351 71,268 94,796 (16,560) 1,019,855 1,019,855
Net income
(loss) $ 1,609,353 $ 132,067 $ 186,027 $ $ (118,300) $ 1,809,147 $ $ 1,809,147
Loans held for
investment $ 49,463,522 $ 16,372,019 $ 23,386,490 $ $ 16,305,460 $ 105,527,491 $ (45,679,810) $ 59,847,681