Capital One 2006 Annual Report Download - page 47
Download and view the complete annual report
Please find page 47 of the 2006 Capital One annual report below. You can navigate through the pages in the report by either clicking on the pages listed below, or by using the keyword search tool below to find specific information within the annual report.-
 1
1 -
2
-
3
-
4
-
5
-
6
-
7
-
8
-
9
-
10
-
11
-
12
-
13
-
14
-
15
-
16
-
17
-
18
-
19
-
20
-
21
-
22
-
23
-
24
-
25
-
26
-
27
-
28
-
29
-
30
-
31
-
32
-
33
-
34
-
35
-
36
-
 37
37 -
 38
38 -
 39
39 -
 40
40 -
 41
41 -
 42
42 -
 43
43 -
 44
44 -
 45
45 -
 46
46 -
 47
47 -
 48
48 -
 49
49 -
 50
50 -
 51
51 -
 52
52 -
 53
53 -
 54
54 -
 55
55 -
 56
56 -
 57
57 -
58
-
59
-
60
-
61
-
62
-
63
-
64
-
65
-
66
-
67
-
68
-
69
-
70
-
71
-
72
-
73
-
74
-
75
-
76
-
77
-
78
-
79
-
80
-
81
-
82
-
83
-
84
-
85
-
86
-
87
-
88
-
89
-
90
-
91
-
92
-
93
-
94
-
95
-
96
-
97
-
98
-
99
-
100
-
101
-
102
-
103
-
104
-
105
-
106
-
107
-
108
-
109
-
110
-
111
-
112
-
113
-
114
-
115
-
116
-
117
-
118
-
119
-
120
-
121
-
122
-
123
-
124
-
125
-
126
-
127
-
128
-
129
-
130
-
131
-
132
-
133
-
134
-
135
-
136
-
137
-
138
-
139
-
140
-
141
-
142
-
143
-
144
-
145
-
146
-
147
-
148
 |
 |
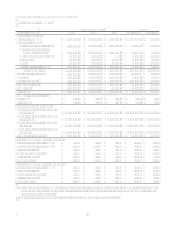
29
market participants use when estimating future net servicing income, including prepayment speeds, discount rates, default
rates, cost to service, escrow account earnings, contractual servicing fee income, ancillary income and late fees. This model is
highly sensitive to changes in certain assumptions. Different anticipated prepayment speeds, in particular, can result in
substantial changes in the estimated fair value of MSRs. If actual prepayment experience differs from the anticipated rates
used in the Companys model, this difference could result in a material change in MSR value.
MSRs are amortized in proportion to, and over the period of, estimated net servicing income. The amortization of MSRs is
analyzed quarterly and adjusted to reflect changes in prepayment speeds.
The MSR balance is $252.3 million at December 31, 2006.
Valuation of Representation and Warranty Reserve
The representation and warranty reserve is available to cover probable losses inherent with the sale of mortgage loans in the
secondary market by GreenPoint. In the normal course of business, certain representations and warranties are made to
investors at the time of sale, which permit the investor to return the loan to the seller or require the seller to indemnify the
investor for losses incurred by the investor while the loan remains outstanding. The evaluation process for determining the
adequacy of the representation and warranty reserve and the periodic provisioning for estimated losses is performed for each
product type on a quarterly basis. Factors considered in the evaluation process include historical sales volumes, aggregate
repurchase and indemnification activity and actual losses incurred.
As of December 31, 2006, the representation and warranty reserve carried a balance of $156.0 million.
Valuation of Retained Interests from Securitization Transactions
Loan securitization involves the transfer of a pool of loan receivables to a trust or other special purpose entity. The trust sells
an undivided interest in the pool of loan receivables to third-party investors through the issuance of asset backed securities
and distributes the proceeds to the Company as consideration for the loans transferred. The Company removes loan
receivables from the Consolidated Balance Sheets for securitizations that qualify as sales in accordance with Statement of
Financial Accounting Standards No. 140, Accounting for Transfers and Servicing of Financial Assets and Extinguishment of
Liabilitiesa Replacement of FASB Statement No. 125 (SFAS 140). The trusts are qualified special purpose entities as
defined by SFAS 140 and are not subsidiaries of the Company and are not included in the Companys consolidated financial
statements. The gain on sale recorded from off-balance sheet securitizations is based on the estimated fair value of the assets
sold and retained and liabilities incurred, and is recorded at the time of sale, net of transaction costs. The related receivable is
the interest-only strip, which is based on the present value of the estimated future cash flows from excess finance charges and
past-due fees over the sum of the return paid to security holders, estimated contractual servicing fees and credit losses.
Certain estimates inherent in the determination of the fair value of the retained interests are influenced by factors outside the
Companys control, and as a result, such estimates could materially change and actual results could be materially different
from such estimates. Any future gains that will be recognized in accordance with SFAS 140 will be dependent on the timing
and amount of future securitizations. The Company intends to continuously assess the performance of new and existing
securitization transactions, and therefore the valuation of retained interests, as estimates of future cash flows change.
As of December 31, 2006, the retained interest on the Consolidated Balance sheet was $2.2 billion.
Recognition of Customer Rewards Liability
The Company offers credit cards that provide program members with various rewards such as airline tickets, free or deeply
discounted products or cash rebates, based on purchase volume. The Company establishes a rewards liability based on points
earned which are ultimately expected to be redeemed and the average cost per point redemption. As points are redeemed, the
rewards liability is relieved. The cost of reward programs is reflected as a reduction to interchange income. The rewards
liability will be affected over time as a result of changes in the number of account holders in the reward programs, the actual
amount of points earned and redeemed, general economic conditions, the actual costs of the rewards, changes made by
reward partners and changes that the Company may make to the reward programs in the future. To the extent assumptions
used by management do not prevail, rewards costs could differ significantly, resulting in either a higher or lower future
rewards liability, as applicable.
As of December 31, 2006, the rewards liability was $1.1 billion.