Capital One 2006 Annual Report Download - page 136
Download and view the complete annual report
Please find page 136 of the 2006 Capital One annual report below. You can navigate through the pages in the report by either clicking on the pages listed below, or by using the keyword search tool below to find specific information within the annual report.-
 1
1 -
2
-
3
-
4
-
5
-
6
-
7
-
8
-
9
-
10
-
11
-
12
-
13
-
14
-
15
-
16
-
17
-
18
-
19
-
20
-
21
-
22
-
23
-
24
-
25
-
26
-
27
-
28
-
29
-
30
-
31
-
32
-
33
-
34
-
35
-
36
-
37
-
38
-
39
-
40
-
41
-
42
-
43
-
44
-
45
-
46
-
47
-
48
-
49
-
50
-
51
-
52
-
53
-
54
-
55
-
56
-
57
-
58
-
59
-
60
-
61
-
62
-
63
-
64
-
65
-
66
-
67
-
68
-
69
-
70
-
71
-
72
-
73
-
74
-
75
-
76
-
77
-
78
-
79
-
80
-
81
-
82
-
83
-
84
-
85
-
86
-
87
-
88
-
89
-
90
-
91
-
92
-
93
-
94
-
95
-
96
-
97
-
98
-
99
-
100
-
101
-
102
-
103
-
104
-
105
-
106
-
107
-
108
-
109
-
110
-
111
-
112
-
113
-
114
-
115
-
116
-
117
-
118
-
119
-
120
-
121
-
122
-
123
-
124
-
125
-
 126
126 -
 127
127 -
 128
128 -
 129
129 -
 130
130 -
 131
131 -
 132
132 -
 133
133 -
 134
134 -
 135
135 -
 136
136 -
 137
137 -
 138
138 -
 139
139 -
 140
140 -
 141
141 -
 142
142 -
 143
143 -
 144
144 -
 145
145 -
 146
146 -
147
-
148
 |
 |

118
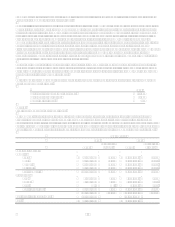
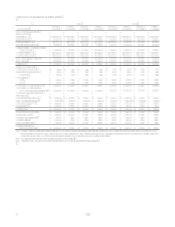
Selected Quarterly Financial Data (1)
2006 2005
(Unaudited) Fourth
Quarter Third
Quarter Second
Quarter First
Quarter Fourth
Quarter Third
Quarter Second
Quarter First
Quarter
Summary of Operations:
(In Thousands)
Interest income $ 2,353,419 $ 2,065,071 $ 1,897,157 $ 1,878,582 $ 1,634,098 $ 1,404,615 $ 1,351,900 $ 1,336,268
Interest expense 952,263 770,556 700,075 671,705 597,099 494,396 479,397 475,747
Net interest income 1,401,156 1,294,515 1,197,082 1,206,877 1,036,999 910,219 872,503 860,521
Provision for loan losses 513,157 430,566 362,445 170,270 565,674 374,167 291,600 259,631
Net interest income after provision
for loan losses 887,999 863,949 834,637 1,036,607 471,325 536,052 580,903 600,890
Non-interest income 1,667,183 1,761,385 1,709,913 1,858,251 1,665,514 1,594,616 1,581,996 1,515,979
Non-interest expense 1,986,188 1,726,629 1,680,897 1,573,479 1,689,186 1,365,638 1,335,617 1,327,832
Income before income taxes 568,994 898,705 863,653 1,321,379 447,653 765,030 827,282 789,037
Income taxes 178,266 310,866 311,066 438,040 167,335 273,881 296,164 282,475
Net income $ 390,728 $ 587,839 $ 552,587 $ 883,339 $ 280,318 $ 491,149 $ 531,118 $ 506,562
Per Common Share:
Basic earnings per share $ 1.16 $ 1.95 $ 1.84 2.95 $ 1.01 $ 1.88 $ 2.10 2.08
Diluted earnings per share 1.14 1.89 1.78 2.86 0.97 1.81 2.03 1.99
Dividends 0.03 0.03 0.03 0.03 0.03 0.03 0.03 0.03
Market prices
High 82.72 86.17 87.23 89.92 88.56 85.97 80.42 84.75
Low 74.97 69.88 81.10 80.52 71.15 77.89 69.10 73.15
Average common shares (000s) 336,470 301,571 300,829 299,257 278,752 260,918 252,585 243,978
Average common shares and
common equivalent shares (000s) 343,779 310,386 309,988 309,121 287,694 270,693 261,664 255,181
Average Balance Sheet Data:
(In Millions)
Loans held for investment $ 74,738 $ 62,429 $ 58,833 $ 58,142 $ 48,701 $ 38,556 $ 38,237 $ 38,204
Allowance for loan losses (1,929 ) (1,767) (1,678 ) (1,789) (1,585) (1,405) (1,439 ) (1,510)
Liquidity portfolio(2)(3) 22,619 16,683 17,870 17,686 15,791 12,844 11,578 10,800
Other assets(3) 18,214 14,950 14,619 14,856 11,536 9,209 8,587 8,794
Total assets $ 113,642 $ 92,295 $ 89,644 $ 88,895 $ 74,443 $ 59,204 $ 56,963 $ 56,288
Interest-bearing deposits $ 53,735 $ 42,984 $ 42,797 $ 43,357 $ 34,738 $ 26,618 $ 26,391 $ 25,655
Other borrowings 20,556 18,011 16,928 16,074 13,703 10,698 10,839 10,698
Senior and deposit notes 9,035 6,545 5,576 6,098 6,707 6,684 6,988 6,909
Other liabilities 12,005 8,445 8,762 8,754 6,767 4,402 3,820 4,458
Stockholders equity 18,311 16,310 15,581 14,612 12,528 10,802 8,925 8,568
Total liabilities and
stockholders equity $ 113,642 $ 92,295 $ 89,644 $ 88,895 $ 74,443 $ 59,204 $ 56,963 $ 56,288
(1) The above schedule is a tabulation of the Companys unaudited quarterly results for the years ended December 31, 2006 and 2005. The Companys common
shares are traded on the New York Stock Exchange under the symbol COF. In addition, shares may be traded in the over-the-counter stock market. There were
19,763 and 11,856 common stockholders of record as of December 31, 2006 and 2005, respectively.
(2) Liquidity portfolio includes $9.5 billion of pledged securities.
(3) Prior period amounts have been reclassified to conform with current period presentation.