Capital One 2006 Annual Report Download - page 66
Download and view the complete annual report
Please find page 66 of the 2006 Capital One annual report below. You can navigate through the pages in the report by either clicking on the pages listed below, or by using the keyword search tool below to find specific information within the annual report.-
 1
1 -
2
-
3
-
4
-
5
-
6
-
7
-
8
-
9
-
10
-
11
-
12
-
13
-
14
-
15
-
16
-
17
-
18
-
19
-
20
-
21
-
22
-
23
-
24
-
25
-
26
-
27
-
28
-
29
-
30
-
31
-
32
-
33
-
34
-
35
-
36
-
37
-
38
-
39
-
40
-
41
-
42
-
43
-
44
-
45
-
46
-
47
-
48
-
49
-
50
-
51
-
52
-
53
-
54
-
55
-
 56
56 -
 57
57 -
 58
58 -
 59
59 -
 60
60 -
 61
61 -
 62
62 -
 63
63 -
 64
64 -
 65
65 -
 66
66 -
 67
67 -
 68
68 -
 69
69 -
 70
70 -
 71
71 -
 72
72 -
 73
73 -
 74
74 -
 75
75 -
 76
76 -
77
-
78
-
79
-
80
-
81
-
82
-
83
-
84
-
85
-
86
-
87
-
88
-
89
-
90
-
91
-
92
-
93
-
94
-
95
-
96
-
97
-
98
-
99
-
100
-
101
-
102
-
103
-
104
-
105
-
106
-
107
-
108
-
109
-
110
-
111
-
112
-
113
-
114
-
115
-
116
-
117
-
118
-
119
-
120
-
121
-
122
-
123
-
124
-
125
-
126
-
127
-
128
-
129
-
130
-
131
-
132
-
133
-
134
-
135
-
136
-
137
-
138
-
139
-
140
-
141
-
142
-
143
-
144
-
145
-
146
-
147
-
148
 |
 |

48
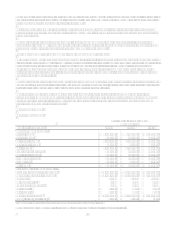
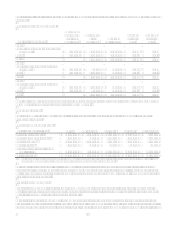
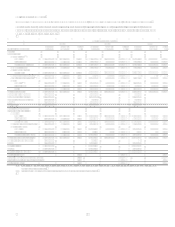
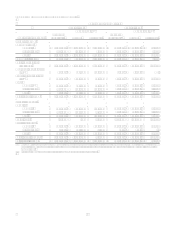
Table 9 reflects the costs of other borrowings of the Company as of and for each of the years ended December 31, 2006, 2005
and 2004.
Table 9: Short Term Borrowings
(Dollars in Thousands)
Maximum
Outstanding
as of any
Month-End
Outstanding
as of
Year-End
Average
Outstanding
Average
Interest
Rate
Year-End
Interest
Rate
2006:
Federal funds purchased and resale
agreements $ 3,736,470 $ 3,736,470 $ 1,662,961 4.20% 5.27%
Other 3,198,710 1,716,055 1,323,998 5.75 5.89
Total $ 5,452,525 $ 2,986,959 4.89% 5.28%
2005:
Federal funds purchased and resale
agreements $ 2,332,173 $ 745,719 $ 704,458 2.69% 3.62%
Other 1,453,181 1,271,014 840,860 4.88 2.09
Total $ 2,016,733 $ 1,545,318 3.88% 2.66%
2004:
Federal funds purchased and resale
agreements $ 1,154,073 $ 1,154,073 $ 503,482 1.29% 1.78%
Other 1,318,404 201,622 763,303 3.85 2.10
Total $ 1,355,695 $ 1,266,785 2.83% 1.83%
Additional information regarding funding can be found on pages 86-88 in Item 8 Financial Statements and Supplementary
DataNotes to the Consolidated Financial StatementsNote 9.
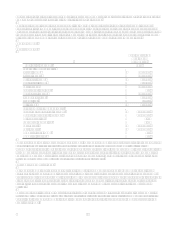
Funding Obligations
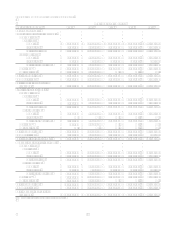
Table 10 summarizes the amounts and maturities of the contractual funding obligations of the Company, including off-
balance sheet funding.
Table 10: Funding Obligations
As of December 31, 2006 Total Up to 1 year 1-3 years 4-5 years After 5 years
Interest-bearing deposits $ 74,122,822 $ 31,405,210 $ 17,818,354 $ 16,920,101 $ 7,979,157
Senior and subordinated notes 9,725,470 461,546 3,416,786 3,948,092 1,899,046
Other borrowings(1) 24,257,007 13,303,627 8,271,657 1,035,768 1,645,955
Operating leases 1,121,572 141,116 261,879 103,082 615,495
Off-balance sheet securitization
amortization 48,993,094 7,922,199 18,458,879 12,317,776 10,294,240
Total obligations $ 158,219,965 $ 53,233,698 $ 48,227,555 $ 34,324,819 $ 22,433,893
(1) Other borrowings includes secured borrowings for the Companys on-balance sheet auto loan securitizations, junior subordinated capital income securities and
debentures, FHLB advances, federal funds purchased and resale agreements and other short-term borrowings.
The terms of the lease and credit facility agreements related to certain other borrowings and operating leases in Table 10
require several financial covenants (including performance measures and equity ratios) to be met. If these covenants are not
met, there may be an acceleration of the payment due dates noted above. As of December 31, 2006, the Company was not in
default of any such covenants.
Liquidity Risk Management
Liquidity risk management refers to the way the Company manages the use and availability of various funding sources to
meet its current and future operating needs. These needs are largely a result of asset growth, securitization, debt and deposit
maturities, and payments of other corporate obligations.
To facilitate liquidity risk management, the Company uses a variety of funding sources to establish a maturity pattern that
provides a prudent mixture of short-term and long-term funds. The Company obtains funds through the gathering of deposits,
issuing debt and equity, and securitizing assets. Further liquidity is provided to the Company through committed facilities. As