Capital One 2006 Annual Report Download - page 54
Download and view the complete annual report
Please find page 54 of the 2006 Capital One annual report below. You can navigate through the pages in the report by either clicking on the pages listed below, or by using the keyword search tool below to find specific information within the annual report.-
 1
1 -
2
-
3
-
4
-
5
-
6
-
7
-
8
-
9
-
10
-
11
-
12
-
13
-
14
-
15
-
16
-
17
-
18
-
19
-
20
-
21
-
22
-
23
-
24
-
25
-
26
-
27
-
28
-
29
-
30
-
31
-
32
-
33
-
34
-
35
-
36
-
37
-
38
-
39
-
40
-
41
-
42
-
43
-
 44
44 -
 45
45 -
 46
46 -
 47
47 -
 48
48 -
 49
49 -
 50
50 -
 51
51 -
 52
52 -
 53
53 -
 54
54 -
 55
55 -
 56
56 -
 57
57 -
 58
58 -
 59
59 -
 60
60 -
 61
61 -
 62
62 -
 63
63 -
 64
64 -
65
-
66
-
67
-
68
-
69
-
70
-
71
-
72
-
73
-
74
-
75
-
76
-
77
-
78
-
79
-
80
-
81
-
82
-
83
-
84
-
85
-
86
-
87
-
88
-
89
-
90
-
91
-
92
-
93
-
94
-
95
-
96
-
97
-
98
-
99
-
100
-
101
-
102
-
103
-
104
-
105
-
106
-
107
-
108
-
109
-
110
-
111
-
112
-
113
-
114
-
115
-
116
-
117
-
118
-
119
-
120
-
121
-
122
-
123
-
124
-
125
-
126
-
127
-
128
-
129
-
130
-
131
-
132
-
133
-
134
-
135
-
136
-
137
-
138
-
139
-
140
-
141
-
142
-
143
-
144
-
145
-
146
-
147
-
148
 |
 |

36
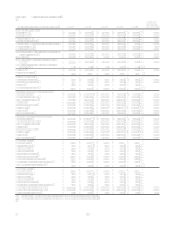
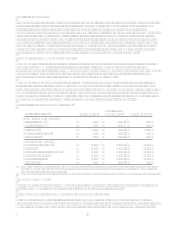
CAPITAL ONE FINANCIAL CORPORATION
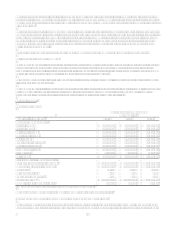
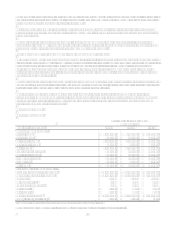
Table 1: Financial Summary
Year Ended December 31, Change
(Dollars in thousands) 2006 2005 2004 2006 vs. 2005 2005 vs. 2004
Earnings (Reported):
Net Interest Income $ 5,099,630 $ 3,680,242 $ 3,002,978 $ 1,419,388 $ 677,264
Non-Interest Income:
Servicing and securitizations 4,209,637 3,945,183 3,635,465 264,454 309,718
Service charges and other
customer-related fees 1,770,340 1,493,690 1,482,658 276,650 11,032
Mortgage banking operations 173,320 142,894 30,426 142,894
Interchange 549,074 514,196 475,810 34,878 38,386
Other 294,361 262,142 306,224 32,219 (44,082)
Total non-interest income 6,996,732 6,358,105 5,900,157 638,627 457,948
Total Revenue (1) 12,096,362 10,038,347 8,903,135 2,058,015 1,135,212
Provision for loan losses 1,476,438 1,491,072 1,220,852 (14,634) 270,220
Marketing 1,444,635 1,379,938 1,337,780 64,697 42,158
Operating expenses 5,522,558 4,338,335 3,984,439 1,184,223 353,896
Income before taxes 3,652,731 2,829,002 2,360,064 823,729 468,938
Income taxes 1,238,238 1,019,855 816,582 218,383 203,273
Net Income $ 2,414,493 $ 1,809,147 $ 1,543,482 $ 605,346 $ 265,665
Common Share Statistics:
Basic EPS $ 7.80 $ 6.98 $ 6.55 $ 0.82 $ 0.43
Diluted EPS $ 7.62 $ 6.73 $ 6.21 $ 0.89 $ 0.52
Selected Balance Sheet Data:
Reported loans held for investment
(period end) $ 96,512,139 $ 59,847,681 $ 38,215,591 $ 36,664,458 $ 21,632,090
Managed loans held for investment
(period end) 146,151,268 105,527,491 79,861,299 40,623,777 25,666,192
Reported loans held for investment
(average) 63,577,279 40,734,237 34,265,668 22,843,042 6,468,569
Managed loans held for investment
(average) 111,328,595 85,265,023 73,711,673 26,063,572 11,553,350
Allowance for loan losses $ 2,180,000 $ 1,790,000 $ 1,505,000 $ 390,000 $ 285,000
Selected Company Metrics (Reported):
Return on average assets (ROA) 2.52% 2.95% 3.05% (0.43) (0.10)
Return on average equity (ROE) 14.90% 17.08% 21.16% (2.18) (4.08)
Net charge-off rate 2.21% 3.55% 3.78% (1.34) (0.23)
30+ day delinquency rate 2.74% 3.14% 3.85% (0.40) (0.71)
Net interest Margin 6.03% 6.63% 6.44% (0.60) 0.19
Revenue margin 14.31% 18.08% 19.08% (3.77) (1.00)
Selected Company Metrics (Managed):
Return on average assets (ROA) 1.69% 1.72% 1.73% (0.03) (0.01)
Net charge-off rate 2.84% 4.25% 4.41% (1.41) (0.16)
30+ day delinquency rate 3.02% 3.24% 3.82% (0.22) (0.58)
Net interest Margin 6.86% 7.80% 7.88% (0.94) (0.08)
Revenue margin 10.63% 12.46% 12.89% (1.83) (0.43)
(1) In accordance with the Companys finance charge and fee revenue recognition policy, the amounts billed to customers
but not recognized as revenue were $0.9 billion, $1.0 billion and $1.1 billion for the years ended December 31, 2006,
2005 and 2004, respectively.
(2) Prior year data has been updated to reflect a reclass for mortgage loans held for sale.