Capital One 2006 Annual Report Download - page 55
Download and view the complete annual report
Please find page 55 of the 2006 Capital One annual report below. You can navigate through the pages in the report by either clicking on the pages listed below, or by using the keyword search tool below to find specific information within the annual report.-
 1
1 -
2
-
3
-
4
-
5
-
6
-
7
-
8
-
9
-
10
-
11
-
12
-
13
-
14
-
15
-
16
-
17
-
18
-
19
-
20
-
21
-
22
-
23
-
24
-
25
-
26
-
27
-
28
-
29
-
30
-
31
-
32
-
33
-
34
-
35
-
36
-
37
-
38
-
39
-
40
-
41
-
42
-
43
-
44
-
 45
45 -
 46
46 -
 47
47 -
 48
48 -
 49
49 -
 50
50 -
 51
51 -
 52
52 -
 53
53 -
 54
54 -
 55
55 -
 56
56 -
 57
57 -
 58
58 -
 59
59 -
 60
60 -
 61
61 -
 62
62 -
 63
63 -
 64
64 -
 65
65 -
66
-
67
-
68
-
69
-
70
-
71
-
72
-
73
-
74
-
75
-
76
-
77
-
78
-
79
-
80
-
81
-
82
-
83
-
84
-
85
-
86
-
87
-
88
-
89
-
90
-
91
-
92
-
93
-
94
-
95
-
96
-
97
-
98
-
99
-
100
-
101
-
102
-
103
-
104
-
105
-
106
-
107
-
108
-
109
-
110
-
111
-
112
-
113
-
114
-
115
-
116
-
117
-
118
-
119
-
120
-
121
-
122
-
123
-
124
-
125
-
126
-
127
-
128
-
129
-
130
-
131
-
132
-
133
-
134
-
135
-
136
-
137
-
138
-
139
-
140
-
141
-
142
-
143
-
144
-
145
-
146
-
147
-
148
 |
 |
37
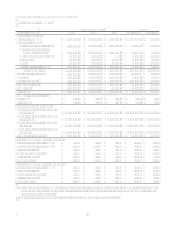
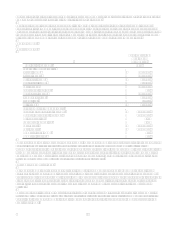
Summary of the Reported Income Statement
The following is a detailed description of the financial results reflected in Table 1 Financial Summary. Additional
information is provided in Section XII, Tabular Summary as detailed in sections below.
All 2006 comparisons are made between the year ended December 31, 2006 and the year ended December 31, 2005. All 2005
comparisons are made between the year ended December 31, 2005 and the year ended December 31, 2004.
Net interest income
Net interest income is comprised of interest income and past-due fees earned and deemed collectible from the Companys
loans and income earned on securities, less interest expense on interest-bearing deposits, senior and subordinated notes and
other borrowings.
For the year ended December 31, 2006, reported net interest income increased 39%, or $1.4 billion, inclusive of $135.1
million from the North Fork acquisition. The increase was due to a 52% increase in reported average earning assets driven by
a full year of Hibernia activity and the recent North Fork acquisition. Net interest margin decreased 60 basis points from
6.63% in 2005 due to spread compression driven primarily by a focus on higher credit quality and a shift in asset mix through
recent acquisitions.
For the year ended December 31, 2005, reported net interest income increased 23%. The increase was primarily due to
significant growth in reported average earning assets. The yield on earning assets and cost of funds remained relatively stable
year over year.
For additional information, see section XII, Tabular Summary, Table A (Statements of Average Balances, Income and
Expense, Yields and Rates) and Table B (Interest Variance Analysis).
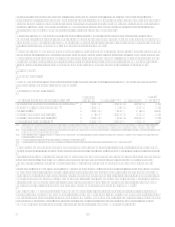
Non-interest income
Non-interest income is comprised of servicing and securitizations income, mortgage banking operations income, service
charges and other customer-related fees, interchange income and other non-interest income.
For the year ended December 31, 2006 and 2005, reported non-interest income increased 10% and 8%, respectively. The
2006 and 2005 increases were both due to year over year increases in servicing and securitizations income, service charges
and other customer-related fees, interchange income, mortgage banking operations income and other non-interest income.
See detailed discussion of the components of non-interest income below.
Servicing and Securitizations Income
Servicing and securitizations income represents servicing fees, excess spread and other fees derived from the off-balance
sheet loan portfolio, adjustments to the fair value of retained interests derived through securitization transactions, as well as
gains and losses resulting securitization and other sales transactions.
Servicing and securitizations income increased 7% for the year ended December 31, 2006. This increase was primarily the
result of a 7% increase in the average off-balance sheet loan portfolio.
Servicing and securitizations income increased 9% for the year ended December 31, 2005. This increase was primarily the
result of a 13% increase in the average off-balance sheet loan portfolio offset by losses from the Gulf Coast hurricanes and
bankruptcy charge-offs resulting from the new bankruptcy legislation.
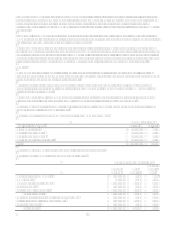
Service Charges and Other Customer-Related Fees
For 2006, Service charges and other customer-related fees grew 19% or $276.7 million, inclusive of $344.2 million from a
full year of Hibernia activity and $16.8 million from the North Fork acquisition. Excluding the impact of acquisitions, service
charges and other customer-related fee income declined $84.5 million or 6%. This is reflective of the reported loan growth
being concentrated in the Auto Finance and Global Financial Services segments that generate lower fee income and
continued declining fee revenue from U.S. Card.
Excluding $44.7 million contributed by businesses acquired in 2005, service charges and other customer-related fees
decreased 2% for the year ended December 31, 2005, while the average reported loan portfolio, exclusive of the 2005
acquisitions, grew 7%. The lower growth in service charges and other customer-related fee income when compared to
average reported loan growth is reflective of the reported loan growth being concentrated in the Auto Finance and Global
Financial Services segments that generate lower fee income.