Capital One 2006 Annual Report Download - page 79
Download and view the complete annual report
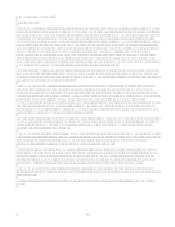
Please find page 79 of the 2006 Capital One annual report below. You can navigate through the pages in the report by either clicking on the pages listed below, or by using the keyword search tool below to find specific information within the annual report.-
 1
1 -
2
-
3
-
4
-
5
-
6
-
7
-
8
-
9
-
10
-
11
-
12
-
13
-
14
-
15
-
16
-
17
-
18
-
19
-
20
-
21
-
22
-
23
-
24
-
25
-
26
-
27
-
28
-
29
-
30
-
31
-
32
-
33
-
34
-
35
-
36
-
37
-
38
-
39
-
40
-
41
-
42
-
43
-
44
-
45
-
46
-
47
-
48
-
49
-
50
-
51
-
52
-
53
-
54
-
55
-
56
-
57
-
58
-
59
-
60
-
61
-
62
-
63
-
64
-
65
-
66
-
67
-
68
-
 69
69 -
 70
70 -
 71
71 -
 72
72 -
 73
73 -
 74
74 -
 75
75 -
 76
76 -
 77
77 -
 78
78 -
 79
79 -
 80
80 -
 81
81 -
 82
82 -
 83
83 -
 84
84 -
 85
85 -
 86
86 -
 87
87 -
 88
88 -
 89
89 -
90
-
91
-
92
-
93
-
94
-
95
-
96
-
97
-
98
-
99
-
100
-
101
-
102
-
103
-
104
-
105
-
106
-
107
-
108
-
109
-
110
-
111
-
112
-
113
-
114
-
115
-
116
-
117
-
118
-
119
-
120
-
121
-
122
-
123
-
124
-
125
-
126
-
127
-
128
-
129
-
130
-
131
-
132
-
133
-
134
-
135
-
136
-
137
-
138
-
139
-
140
-
141
-
142
-
143
-
144
-
145
-
146
-
147
-
148
 |
 |

61
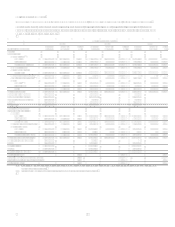
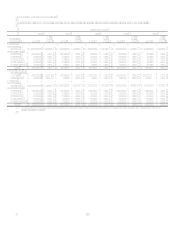
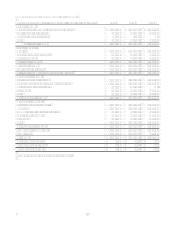
TABLE EDELINQUENCIES
Table E shows the Companys loan delinquency trends for the periods presented on a reported and managed basis.
As of December 31
2006 2005 2004 2003 2002
(Dollars in
thousands) Loans
% of
Total
Loans Loans
% of
Total
Loans Loans
% of
Total
Loans Loans
% of
Total
Loans Loans
% of
Total
Loans
Reported:
Loans held for
investment $ 96,512,139 100.00% $ 59,847,681 100.00% $ 38,215,591 100.00% $ 32,850,269 100.00% $ 27,343,930 100.00%
Loans delinquent:
30-59 days 1,512,365 1.57% 1,055,027 1.76% 741,723 1.94% 755,930 2.30% 762,040 2.79%
60-89 days 563,012 0.58% 401,640 0.67% 313,559 0.82% 362,766 1.10% 373,451 1.37%
90-119 days 291,759 0.30% 230,780 0.39% 196,457 0.51% 207,353 0.63% 238,091 0.87%
120-149 days 167,260 0.17% 104,817 0.18% 120,589 0.32% 149,246 0.45% 174,651 0.64%
150 or more days 114,007 0.12% 86,744 0.14% 99,866 0.26% 98,164 0.31% 125,636 0.45%
Total $ 2,648,403 2.74% $ 1,879,008 3.14% $ 1,472,194 3.85% $ 1,573,459 4.79% $ 1,673,869 6.12%
Loans delinquent by
geographic area:
Domestic 2,543,050 2.74% 1,789,926 3.20% 1,380,022 4.05% 1,509,370 5.06% 1,611,650 6.56%
International 105,353 2.74% 89,082 2.28% 92,172 2.04% 64,089 2.13% 62,219 2.25%
Managed:
Loans held for
investment $ 146,151,268 100.00% $ 105,527,491 100.00% $ 79,861,299 100.00% $ 71,244,796 100.00% $ 59,746,537 100.00%
Loans delinquent:
30-59 days 2,129,884 1.46% 1,620,075 1.54% 1,299,782 1.63% 1,335,231 1.87% 1,366,072 2.29%
60-89 days 945,844 0.65% 740,917 0.70% 664,629 0.83% 718,247 1.01% 753,735 1.26%
90-119 days 602,472 0.41% 498,927 0.47% 479,404 0.60% 488,471 0.69% 526,710 0.88%
120-149 days 412,386 0.28% 309,587 0.29% 336,924 0.42% 365,971 0.51% 394,721 0.66%
150 or more days 323,459 0.22% 254,314 0.24% 273,339 0.34% 270,009 0.38% 304,156 0.51%
Total $ 4,414,045 3.02% $ 3,423,820 3.24% $ 3,054,078 3.82% $ 3,177,929 4.46% $ 3,345,394 5.60%
(1) 2002 reported and managed delinquency rates include 28 basis point and 13 basis point increases, respectively, related to the one-time impact of the 2002 change
in recoveries assumption.