Capital One 2006 Annual Report Download - page 17
Download and view the complete annual report
Please find page 17 of the 2006 Capital One annual report below. You can navigate through the pages in the report by either clicking on the pages listed below, or by using the keyword search tool below to find specific information within the annual report.-
 1
1 -
2
-
3
-
4
-
5
-
6
-
 7
7 -
 8
8 -
 9
9 -
 10
10 -
 11
11 -
 12
12 -
 13
13 -
 14
14 -
 15
15 -
 16
16 -
 17
17 -
 18
18 -
 19
19 -
 20
20 -
 21
21 -
 22
22 -
 23
23 -
 24
24 -
 25
25 -
 26
26 -
 27
27 -
28
-
29
-
30
-
31
-
32
-
33
-
34
-
35
-
36
-
37
-
38
-
39
-
40
-
41
-
42
-
43
-
44
-
45
-
46
-
47
-
48
-
49
-
50
-
51
-
52
-
53
-
54
-
55
-
56
-
57
-
58
-
59
-
60
-
61
-
62
-
63
-
64
-
65
-
66
-
67
-
68
-
69
-
70
-
71
-
72
-
73
-
74
-
75
-
76
-
77
-
78
-
79
-
80
-
81
-
82
-
83
-
84
-
85
-
86
-
87
-
88
-
89
-
90
-
91
-
92
-
93
-
94
-
95
-
96
-
97
-
98
-
99
-
100
-
101
-
102
-
103
-
104
-
105
-
106
-
107
-
108
-
109
-
110
-
111
-
112
-
113
-
114
-
115
-
116
-
117
-
118
-
119
-
120
-
121
-
122
-
123
-
124
-
125
-
126
-
127
-
128
-
129
-
130
-
131
-
132
-
133
-
134
-
135
-
136
-
137
-
138
-
139
-
140
-
141
-
142
-
143
-
144
-
145
-
146
-
147
-
148
 |
 |
15
Percent
(Dollars in millions, Except Per Share Data) 2006 2005(1) Change
Income Statement Data:
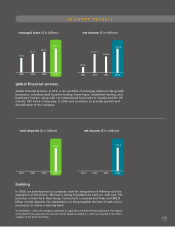
Interest income $ 8,194.2 $ 5,726.9 43.08%
Interest expense 3,094.6 2,046.6 51.21
Net interest income 5,099.6 3,680.3 38.56
Provision for loan losses 1,476.4 1,491.1 (0.99)
Net interest income after provision for loan losses 3,623.2 2,189.2 65.50
Noninterest income 6,996.7 6,358.1 10.04
Noninterest expense 6,967.2 5,718.3 21.84
Income before taxes 3,652.7 2,829.0 29.12
Income taxes 1,238.2 1,019.9 21.40
Net income $ 2,414.5 $ 1,809.1 33.46
Dividend payout ratio 1.34% 1.52% (11.94)
Per Common Share:
Basic earnings per share $ 7.80 $ 6.98 11.75
Diluted earnings per share 7.62 6.73 13.22
Dividends 0.11 0.11 —
Book value as of year-end 61.56 46.97 31.06
Selected Year-End Reported Balances:
Liquidity portfolio(1) $ 27,730.3 $ 16,491.6 68.15
Loans held for investment 96,512.1 59,847.7 61.26
Allowance for loan losses (2,180.0) (1,790.0) 21.79
Total assets 149,739.3 88,701.4 68.81
Interest-bearing deposits 74,122.8 43,092.1 72.01
Borrowings 33,982.5 22,278.1 52.54
Stockholders’ equity 25,235.2 14,128.9 78.61
Selected Average Reported Balances:
Liquidity portfolio(1) $ 18,794.4 $ 12,797.1 46.86
Loans held for investment 63,577.3 40,734.2 56.08
Allowance for loan losses (1,791.2) (1,482.9) 20.79
Total assets 95,809.8 61,360.5 56.14
Interest-bearing deposits 45,739.0 28,370.7 61.22
Borrowings 24,724.5 18,031.9 37.12
Stockholders’ equity 16,203.4 10,594.3 52.94
Reported Metrics:
Revenue margin(1) 14.31% 18.08%
Net interest margin(1) 6.03 6.63
Delinquency rate 2.74 3.14
Net charge-off rate 2.21 3.55
Return on average assets 2.52 2.95
Return on average equity 14.90 17.08
Average equity to average assets 16.91 17.27
Operating expense as a % of average loans 8.69 10.65
Allowance for loan losses to loans 2.26 2.99
Managed Metrics:
Revenue margin(1) 10.63% 12.45%
Net interest margin(1) 6.86 7.80
Delinquency rate 3.02 3.24
Net charge-off rate 2.84 4.25
Return on average assets 1.69 1.72
Operating expense as a % of average loans 4.96 5.09
Average loans held for investment $ 111,328.6 $ 85,265.0 30.57
Year-end loans held for investment $ 146,151.3 $ 105,527.5 38.50
Year-end total loan accounts 50.0 49.7 0.60
(1) 2005 data has been reclassified to conform with current period presentation.