Capital One 2006 Annual Report Download - page 112
Download and view the complete annual report
Please find page 112 of the 2006 Capital One annual report below. You can navigate through the pages in the report by either clicking on the pages listed below, or by using the keyword search tool below to find specific information within the annual report.-
 1
1 -
2
-
3
-
4
-
5
-
6
-
7
-
8
-
9
-
10
-
11
-
12
-
13
-
14
-
15
-
16
-
17
-
18
-
19
-
20
-
21
-
22
-
23
-
24
-
25
-
26
-
27
-
28
-
29
-
30
-
31
-
32
-
33
-
34
-
35
-
36
-
37
-
38
-
39
-
40
-
41
-
42
-
43
-
44
-
45
-
46
-
47
-
48
-
49
-
50
-
51
-
52
-
53
-
54
-
55
-
56
-
57
-
58
-
59
-
60
-
61
-
62
-
63
-
64
-
65
-
66
-
67
-
68
-
69
-
70
-
71
-
72
-
73
-
74
-
75
-
76
-
77
-
78
-
79
-
80
-
81
-
82
-
83
-
84
-
85
-
86
-
87
-
88
-
89
-
90
-
91
-
92
-
93
-
94
-
95
-
96
-
97
-
98
-
99
-
100
-
101
-
 102
102 -
 103
103 -
 104
104 -
 105
105 -
 106
106 -
 107
107 -
 108
108 -
 109
109 -
 110
110 -
 111
111 -
 112
112 -
 113
113 -
 114
114 -
 115
115 -
 116
116 -
 117
117 -
 118
118 -
 119
119 -
 120
120 -
 121
121 -
 122
122 -
123
-
124
-
125
-
126
-
127
-
128
-
129
-
130
-
131
-
132
-
133
-
134
-
135
-
136
-
137
-
138
-
139
-
140
-
141
-
142
-
143
-
144
-
145
-
146
-
147
-
148
 |
 |

94
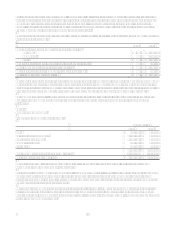
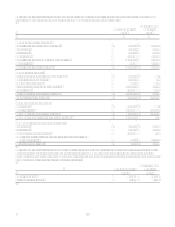
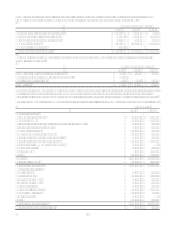
At December 31, 2006
Prior to
Adopting
SFAS 158
Effect of
Adopting
SFAS 158
As Reported
at December 31,
2006
Other assets 3,614,850 82 3,614,932
Other liabilities 4,181,207 (5,260) 4,175,947
Cumulative other comprehensive income 260,838 5,342 266,180
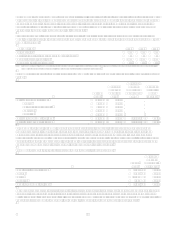
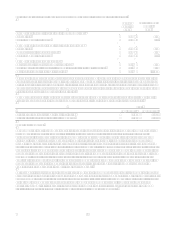
Pretax amounts recognized in cumulative other comprehensive income that have not yet been recognized as a component of
net periodic benefit cost consist of:
Pension Benefits
Postretirement
Benefits
2006 2006
Transition obligation $ $ (331)
Prior service credit 14,712
Net actuarial loss (2,928) (6,163)
Cumulative other comprehensive income $ (2,928) $ 8,218
Pretax amounts in cumulative other comprehensive income that are expected to be recognized as components of net periodic
benefit cost for the year ending December 31, 2007 consist of:
Pension Benefits
Postretirement
Benefits
Transition obligation $ $ 55
Prior service credit (4,570)
Net actuarial loss 149 207
Total $ 149 $ (4,308)
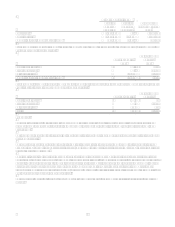
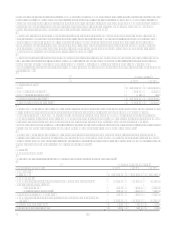
Plan Assets
The actual asset allocation for the year ended December 31, 2006 for the qualified defined benefit pension plan obtained
through the North Fork acquisition as of the measurement date was equity securities of 60%, debt securities of 38%, and
other of 2%.
The investment guidelines for this plan limit equity securities to not more than 60% of assets and debt securities to not more
than 40% of assets.
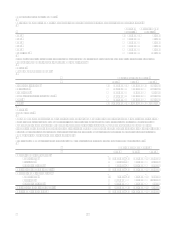
The guidelines specify equity allocations as follows: (1) large capitalization value of 30% to 40%, (2) large capitalization
growth of 20% to 30%, (3) middle capitalization of 10% to 20%, (4) smaller capitalization of 5% to 15%, and (5) diversified
international of 10% to 20%.
Debt securities are limited by the investment guidelines to United States Government obligations or corporate issues rated
Baa or higher by Standard & Poors or Moodys. Cash equivalent securities may be viewed as alternative investment vehicles
and are limited by the guidelines to mutual funds consisting of instruments issued by the United States Government, United
States Treasury, Federal Reserve System or Federal Home Loan Bank, or mutual funds consisting of commercial paper
issued by a domestic corporation rated prime by the National Credit Office, or of individual fixed income instruments rated
A or P1 or higher, maturing in 180 days or less.
The guidelines require that the plans performance be reviewed periodically by comparing total rates of return to specified
indices.