Capital One 2006 Annual Report Download - page 59
Download and view the complete annual report
Please find page 59 of the 2006 Capital One annual report below. You can navigate through the pages in the report by either clicking on the pages listed below, or by using the keyword search tool below to find specific information within the annual report.-
 1
1 -
2
-
3
-
4
-
5
-
6
-
7
-
8
-
9
-
10
-
11
-
12
-
13
-
14
-
15
-
16
-
17
-
18
-
19
-
20
-
21
-
22
-
23
-
24
-
25
-
26
-
27
-
28
-
29
-
30
-
31
-
32
-
33
-
34
-
35
-
36
-
37
-
38
-
39
-
40
-
41
-
42
-
43
-
44
-
45
-
46
-
47
-
48
-
 49
49 -
 50
50 -
 51
51 -
 52
52 -
 53
53 -
 54
54 -
 55
55 -
 56
56 -
 57
57 -
 58
58 -
 59
59 -
 60
60 -
 61
61 -
 62
62 -
 63
63 -
 64
64 -
 65
65 -
 66
66 -
 67
67 -
 68
68 -
 69
69 -
70
-
71
-
72
-
73
-
74
-
75
-
76
-
77
-
78
-
79
-
80
-
81
-
82
-
83
-
84
-
85
-
86
-
87
-
88
-
89
-
90
-
91
-
92
-
93
-
94
-
95
-
96
-
97
-
98
-
99
-
100
-
101
-
102
-
103
-
104
-
105
-
106
-
107
-
108
-
109
-
110
-
111
-
112
-
113
-
114
-
115
-
116
-
117
-
118
-
119
-
120
-
121
-
122
-
123
-
124
-
125
-
126
-
127
-
128
-
129
-
130
-
131
-
132
-
133
-
134
-
135
-
136
-
137
-
138
-
139
-
140
-
141
-
142
-
143
-
144
-
145
-
146
-
147
-
148
 |
 |

41
were established. As a result, results for the Banking segment include the reversal of this allowance. In addition, during the
fourth quarter the Company aligned the allowance for loss methodology for CONAs indirect auto portfolio with the Capital
One legacy auto portfolio. The resulting impact of the methodology alignment was a decrease to the allowance for loan losses
of $36.8 million.
During the fourth quarter, the Company completed a review of the loan portfolios deemed to be impaired in accordance with
SOP 03-3 associated with the acquisition of Hibernia National Bank. Based upon the information available at the time of this
review, the majority of the consumer portfolio and a portion of the commercial portfolio were determined not to have been
impaired at the acquisition date. Therefore, the related SOP 03-3 contra accounts were adjusted, with reclassifications of
approximately $30.8 million of contra asset balances to increase the allowance for loan losses, and approximately $68.8
million to decrease Goodwill.
For additional information, see section XII, Tabular Summary, Table H (Summary of Allowance for Loan Losses).
VII. Reportable Segment Summary
The Company manages its business as four distinct operating segments: U.S. Card, Auto Finance, Global Financial Services
and Banking. The U.S. Card, Auto Finance, Global Financial Services and Banking segments are considered reportable
segments based on quantitative thresholds applied to the managed loan portfolio for reportable segments provided by SFAS
No. 131, Disclosures about Segments of an Enterprise and Related Information.
As management makes decisions on a managed portfolio basis within each segment, information about reportable segments
is provided on a managed basis.
The Company maintains its books and records on a legal entity basis for the preparation of financial statements in conformity
with GAAP. The following table presents information prepared from the Companys internal management information
system, which is maintained on a line of business level through allocations from legal entities.
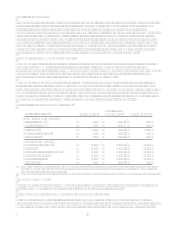
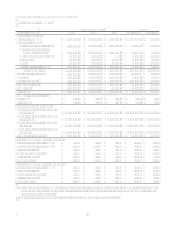
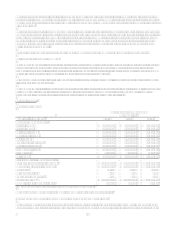
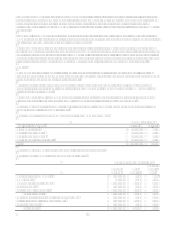
US Card Segment
Table 2: U.S. Card
As of and for the Year Ended
December 31,
(Dollars in thousands) 2006 2005 2004
Earnings (Managed Basis)
Interest income $ 6,872,507 $ 6,614,854 $ 6,368,944
Interest expense 2,156,709 1,820,898 1,713,047
Net interest income 4,715,798 4,793,956 4,655,897
Non-interest income 3,255,681 3,321,457 3,219,567
Total revenue 7,971,479 8,115,413 7,875,464
Provision for loan losses 1,644,619 2,279,109 2,207,888
Non-interest expense 3,521,627 3,356,600 3,499,918
Income before taxes 2,805,233 2,479,704 2,167,658
Income taxes 981,833 870,351 780,357
Net income $ 1,823,400 $ 1,609,353 $ 1,387,301
Selected Metrics (Managed Basis)
Period end loans held for investment $ 53,623,680 $ 49,463,522 $ 48,609,571
Average loans held for investment $ 49,484,223 $ 46,827,775 $ 45,812,973
Loan Yield 13.89% 14.13% 13.90%
Net charge-off rate 3.37% 5.01% 5.05%
30+ day delinquency rate 3.74% 3.44% 3.97%
Purchase Volume(1) $ 83,126,876 $ 73,687,136 $ 64,039,668
Number of Total Accounts (000s) 37,630 37,645 38,269
(1) Includes purchase transactions net of returns and excludes cash advance transactions.
The U.S. Card segment consists of domestic consumer credit card lending activities.
Year Ended December 31, 2006 Compared to Year Ended December 31, 2005
U.S. Card segment earnings increased year over year primarily due to the favorable credit environment. Throughout 2006,
charge-offs remained at historically low levels following the change in bankruptcy legislation in the fourth quarter of 2005.