Capital One 2006 Annual Report Download - page 82
Download and view the complete annual report
Please find page 82 of the 2006 Capital One annual report below. You can navigate through the pages in the report by either clicking on the pages listed below, or by using the keyword search tool below to find specific information within the annual report.-
 1
1 -
2
-
3
-
4
-
5
-
6
-
7
-
8
-
9
-
10
-
11
-
12
-
13
-
14
-
15
-
16
-
17
-
18
-
19
-
20
-
21
-
22
-
23
-
24
-
25
-
26
-
27
-
28
-
29
-
30
-
31
-
32
-
33
-
34
-
35
-
36
-
37
-
38
-
39
-
40
-
41
-
42
-
43
-
44
-
45
-
46
-
47
-
48
-
49
-
50
-
51
-
52
-
53
-
54
-
55
-
56
-
57
-
58
-
59
-
60
-
61
-
62
-
63
-
64
-
65
-
66
-
67
-
68
-
69
-
70
-
71
-
 72
72 -
 73
73 -
 74
74 -
 75
75 -
 76
76 -
 77
77 -
 78
78 -
 79
79 -
 80
80 -
 81
81 -
 82
82 -
 83
83 -
 84
84 -
 85
85 -
 86
86 -
 87
87 -
 88
88 -
 89
89 -
 90
90 -
 91
91 -
 92
92 -
93
-
94
-
95
-
96
-
97
-
98
-
99
-
100
-
101
-
102
-
103
-
104
-
105
-
106
-
107
-
108
-
109
-
110
-
111
-
112
-
113
-
114
-
115
-
116
-
117
-
118
-
119
-
120
-
121
-
122
-
123
-
124
-
125
-
126
-
127
-
128
-
129
-
130
-
131
-
132
-
133
-
134
-
135
-
136
-
137
-
138
-
139
-
140
-
141
-
142
-
143
-
144
-
145
-
146
-
147
-
148
 |
 |

64
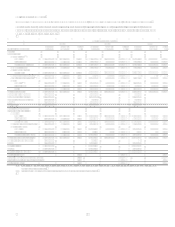
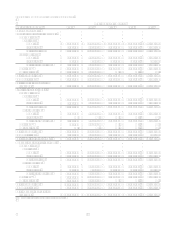
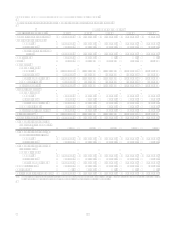
TABLE HSUMMARY OF ALLOWANCE FOR LOAN LOSSES
Table H sets forth activity in the allowance for loan losses for the periods indicated.
Year Ended December 31
(Dollars In Thousands) 2006 2005 2004 2003 2002
Balance at beginning of year $ 1,790,000 $ 1,505,000 $ 1,595,000 $ 1,720,000 $ 840,000
Provision for loan losses:
Domestic 1,235,984 1,327,968 1,085,467 1,388,463 2,025,885
International 240,454 163,104 135,385 129,034 123,443
Total provision for loan
losses 1,476,438 1,491,072 1,220,852 1,517,497 2,149,328
Acquisitions 225,890 224,144
Other 72,821 (12,731) (15,284) 3,863 (9,644)
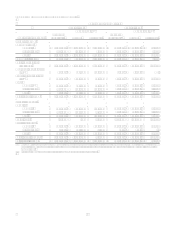
Charge-offs:
Consumer loans:
Domestic (1,547,746) (1,532,499) (1,473,103) (1,722,348) (1,261,265)
International (249,332) (193,360) (135,198) (146,152) (127,276)
Total consumer loans (1,797,078) (1,725,859) (1,608,301) (1,868,500) (1,388,541)
Commercial loans (135,375) (139,977) (140,972) (135,828) (102,300)
Total charge-offs (1,932,453) (1,865,836) (1,749,273) (2,004,328) (1,490,841)
Principal recoveries:
Consumer loans
Domestic 451,781 384,266 388,573 304,003 191,717
International 68,280 43,560 43,212 37,619 27,745
Total consumer loans 520,061 427,826 431,785 341,622 219,462
Commercial loans 27,243 20,525 21,920 16,346 11,695
Total principal recoveries 547,304 448,351 453,705 357,968 231,157
Net charge-offs(1) (1,385,149) (1,417,485) (1,295,568) (1,646,360) (1,259,684)
Balance at end of year $ 2,180,000 $ 1,790,000 $ 1,505,000 $ 1,595,000 $ 1,720,000
Allowance for loan losses to
loans held for investment at
end of year 2.26% 2.99% 3.94% 4.86% 6.29%
Allowance for loan losses by
geographic distribution:
Domestic $ 1,949,864 $ 1,639,277 $ 1,354,849 $ 1,477,314 $ 1,636,405
International 230,136 150,723 150,151 117,686 83,595
Allowance for loan losses by
loan category:
Consumer loans:
Domestic $ 1,584,025 $ 1,405,909 $ 1,222,083 $ 1,341,850 $ 1,507,655
International 230,136 150,723 150,151 117,686 83,595
Total consumer loans 1,814,161 1,556,632 1,372,234 1,459,536 1,591,250
Commercial loans 365,839 221,975 132,766 135,464 128,750
Unallocated 11,393
Total loans held for investment $ 2,180,000 $ 1,790,000 $ 1,505,000 $ 1,595,000 $ 1,720,000
(1) Does not include the charge-offs of certain loans which have been segregated into pools apart from the remaining portfolio and accounted for under Statement of
Position 03-3, Accounting for Certain Loans or Debt Securities Acquired in a Transfer (SOP 03-3).