Experian 2014 Annual Report Download - page 96
Download and view the complete annual report
Please find page 96 of the 2014 Experian annual report below. You can navigate through the pages in the report by either clicking on the pages listed below, or by using the keyword search tool below to find specific information within the annual report.-
 1
1 -
2
-
3
-
4
-
5
-
6
-
7
-
8
-
9
-
10
-
11
-
12
-
13
-
14
-
15
-
16
-
17
-
18
-
19
-
20
-
21
-
22
-
23
-
24
-
25
-
26
-
27
-
28
-
29
-
30
-
31
-
32
-
33
-
34
-
35
-
36
-
37
-
38
-
39
-
40
-
41
-
42
-
43
-
44
-
45
-
46
-
47
-
48
-
49
-
50
-
51
-
52
-
53
-
54
-
55
-
56
-
57
-
58
-
59
-
60
-
61
-
62
-
63
-
64
-
65
-
66
-
67
-
68
-
69
-
70
-
71
-
72
-
73
-
74
-
75
-
76
-
77
-
78
-
79
-
80
-
81
-
82
-
83
-
84
-
85
-
 86
86 -
 87
87 -
 88
88 -
 89
89 -
 90
90 -
 91
91 -
 92
92 -
 93
93 -
 94
94 -
 95
95 -
 96
96 -
 97
97 -
 98
98 -
 99
99 -
 100
100 -
 101
101 -
 102
102 -
 103
103 -
 104
104 -
 105
105 -
 106
106 -
107
-
108
-
109
-
110
-
111
-
112
-
113
-
114
-
115
-
116
-
117
-
118
-
119
-
120
-
121
-
122
-
123
-
124
-
125
-
126
-
127
-
128
-
129
-
130
-
131
-
132
-
133
-
134
-
135
-
136
-
137
-
138
-
139
-
140
-
141
-
142
-
143
-
144
-
145
-
146
-
147
-
148
-
149
-
150
-
151
-
152
-
153
-
154
-
155
-
156
-
157
-
158
-
159
-
160
-
161
-
162
-
163
-
164
-
165
-
166
-
167
-
168
-
169
-
170
-
171
-
172
-
173
-
174
-
175
-
176
-
177
-
178
 |
 |

92
Annual report on remuneration continued
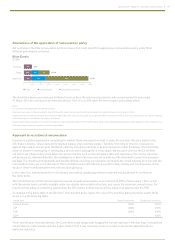
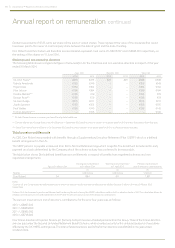
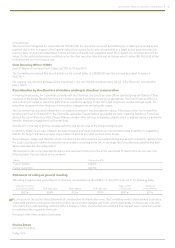
CEO’s remuneration in last five years
Year 2010 2011 2012 2013 2014
CEO’s total single figure US$’000 6,729 5,714 23,206 22,974 16,846
Bonus – % of maximum achieved 100% 98% 100% 75% 50%
PSP and CIP matching awards – % of maximum vesting 70% –100% 100% 94%
On the demerger from GUS plc in 2006, outstanding awards were automatically rolled over into awards over Experian shares. In
order to provide a lock-in mechanism at that time, Don Robert’s awards were structured to vest in 2010 and 2011 although their
performance periods ended in 2009.
In calculating the single figures above, the prescribed methodology requires that the value of any awards is included in the financial
year in which the relevant performance period ends. The value of the awards described above, therefore, would be included in the
single figure for 2009 and not in 2010 or 2011 when the awards vested. For this reason, the above figures for 2010 and 2011 are lower.
In the single figure for 2012, 75% of the value was realised through the vesting of long-term equity incentives. Over the relevant
performance period for those awards, the Company’s TSR was 148%. In 2013, the proportion of value realised through long-term
equity incentives was 78% and the Company’s TSR over the performance period of those awards was 91%. The breakdown and
explanation of the 2014 total single figure is given earlier and 71% of the value was realised as a result of the vesting of long-term
equity incentives. The Company’s TSR over the performance period of those awards was 49%.
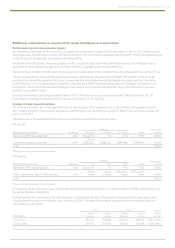
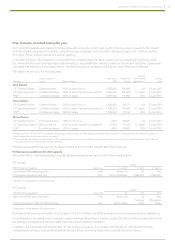
Percentage change in CEO’s remuneration (not audited)
The table below shows the percentage change in the CEO’s salary, benefits and annual bonus between 2013 and 2014 and how this
compares to the average percentage change for our UK and Ireland employees. The figures for UK and Ireland employees reflect
average salaries and average employee numbers each year. The annual bonus figure includes sales incentive plans.
The Committee has selected employees in the UK and Ireland to illustrate the comparison because Experian is a UK-listed company
and it avoids the impact of foreign exchange rates, the widely varying approaches to pay across the different regions and the
complexities involved in collating remuneration data across different geographical populations.
Base salary Taxable benefits Annual bonus Total
CEO 2.9% 3.0% (31.4%) (15.5%)
UK and Ireland employees 2.0% (3.1%) 13.7% 6.0%
The UK and Ireland budgeted annual salary increase for the year ended 31 March 2014 was 3.0%. However, the impact of reduced
headcount on average salary has reduced the overall growth to 2.0%. Similarly, this has had an impact on the taxable benefits figure.
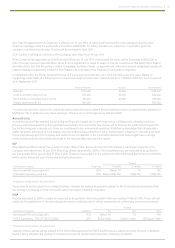
Relative importance of spend on pay (not audited)
The table below illustrates the relative importance of remuneration spend for all employees compared to the financial distributions to
shareholders, through dividends and earnings-enhancing share repurchases, over the same period.
2014
USD$m
2013
USD$m % change
Employee remuneration costs 1,830 1,835 0.3%
Dividends paid on ordinary shares 349 322 8.4%
Estimated value of earnings-enhancing share repurchases 191 14 1,264.3%
Over the year ended 31 March 2014 the number of full time equivalent employees fell by 1.7%. Whilst overall remuneration costs fell,
as shown in the table, the average cost per employee rose by 1.6%.
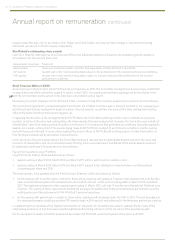
Statement of implementation of remuneration policy in the following financial year (not audited)
The remuneration policy will take effect from the AGM on 16 July 2014 and will be in line with the policy we implemented during
the year ended 31 March 2014. For clarity, the same policy which applied for the year ended 31 March 2014 will apply for the period
between 1 April 2014 and the AGM.
Salary and fees
The salaries that apply from the start of the year ending 31 March 2015 are set out in the following table:
Salary to 31 March 2014 Salary from 1 April 2014
Don Robert US$1,595,000 US$1,595,000
Chris Callero US$1,015,000 US$1,015,000
Brian Cassin £462,500 £462,500
Governance • Report on directors’ remuneration