Experian 2014 Annual Report Download - page 23
Download and view the complete annual report
Please find page 23 of the 2014 Experian annual report below. You can navigate through the pages in the report by either clicking on the pages listed below, or by using the keyword search tool below to find specific information within the annual report.-
 1
1 -
2
-
3
-
4
-
5
-
6
-
7
-
8
-
9
-
10
-
11
-
12
-
 13
13 -
 14
14 -
 15
15 -
 16
16 -
 17
17 -
 18
18 -
 19
19 -
 20
20 -
 21
21 -
 22
22 -
 23
23 -
 24
24 -
 25
25 -
 26
26 -
 27
27 -
 28
28 -
 29
29 -
 30
30 -
 31
31 -
 32
32 -
 33
33 -
34
-
35
-
36
-
37
-
38
-
39
-
40
-
41
-
42
-
43
-
44
-
45
-
46
-
47
-
48
-
49
-
50
-
51
-
52
-
53
-
54
-
55
-
56
-
57
-
58
-
59
-
60
-
61
-
62
-
63
-
64
-
65
-
66
-
67
-
68
-
69
-
70
-
71
-
72
-
73
-
74
-
75
-
76
-
77
-
78
-
79
-
80
-
81
-
82
-
83
-
84
-
85
-
86
-
87
-
88
-
89
-
90
-
91
-
92
-
93
-
94
-
95
-
96
-
97
-
98
-
99
-
100
-
101
-
102
-
103
-
104
-
105
-
106
-
107
-
108
-
109
-
110
-
111
-
112
-
113
-
114
-
115
-
116
-
117
-
118
-
119
-
120
-
121
-
122
-
123
-
124
-
125
-
126
-
127
-
128
-
129
-
130
-
131
-
132
-
133
-
134
-
135
-
136
-
137
-
138
-
139
-
140
-
141
-
142
-
143
-
144
-
145
-
146
-
147
-
148
-
149
-
150
-
151
-
152
-
153
-
154
-
155
-
156
-
157
-
158
-
159
-
160
-
161
-
162
-
163
-
164
-
165
-
166
-
167
-
168
-
169
-
170
-
171
-
172
-
173
-
174
-
175
-
176
-
177
-
178
 |
 |

19
Buildings
Transport
CO2e emission per
US$1,000 of revenue
(kilograms)
CO2e emission per
full time equivalent
employee (tonnes)
50 14.6 4.2
16.0 4.5
14.8 4.1
17.1 4.9
18.3 4.8
49
50
54
55
21
21
22
19
16
Strategic report • Key performance indicators
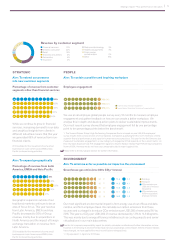
Aim: To extend our presence
into new customer segments
Percentage of revenue from customer
segments other than financial services
While we continue to grow in financial
services, increasing demand for our data
and analytical insights from clients in
different industries means that this year
we generated 69% of revenue from non-
financial clients.
2013 restated for the movement of some small
businesses in Latin America and EMEA/Asia
Pacific to discontinuing activities.
STRATEGIC
Aim: To expand geographically
Percentage of revenue from Latin
America, EMEA and Asia Pacific
Geographic expansion outside of our
traditional markets continues to be an
area of focus for us. This year revenue
from Latin America, EMEA and Asia
Pacific decreased to 30% of Group
revenue, mainly due to acquisitions in
North America and the impact of foreign
exchange translation on revenue from
Latin America.
2013 restated for the movement of some small
businesses in Latin America and EMEA/Asia
Pacific to discontinuing activities.
Aim: To sustain a positive and inspiring workplace
Employee engagement
Aim: To minimise as far as possible our impact on the environment
Greenhouse gas emissions (000s CO2e¹ tonnes)
We use an all-employee global people survey every 18 months to measure employee
engagement and gather feedback on how we can create a better workplace. We
analyse this in depth and develop action plans to deliver sustainable improvements.
Our most recent survey showed that employee engagement fell by one percentage
point to ten percentage points below the benchmark¹.
1. The Towers Watson Global High Performing Companies Norm is based on over 500,000 employees’
survey results from a cross-section of 28 companies. Companies qualifying for this norm meet two criteria:
superior financial performance and superior human resources practices. This year for the first time we also
measured ‘sustainable engagement’, a new category of engagement that expands on the current metric: on
this new basis Experian had 75% engagement against a Towers Watson Global High Performing Companies
Norm of 82%. However we do not have any comparable data to report against this.
Please refer to the Our people section for further information.
PEOPLE
Revenue by customer segment
Financial services 31%
Direct-to-consumer 22%
Retail 10%
Telecoms and utilities 5%
Automotive 5%
Insurance 4%
Media and technology 3%
Healthcare payments 3%
Public sector
and education 2%
Other 15%
ENVIRONMENT
Our most significant environmental impact is from energy use at our offices and data
centres, and from employee travel. We calculate our carbon emissions from these
sources and our target is to reduce CO2e emissions per US$1,000 of revenue by 5%² by
2016. This year our CO2e per US$1,000 of revenue decreased by 1.3% to 14.6 kilograms.
This was mainly due to energy efficiency initiatives such as cooling projects and server
virtualisations in our main data centres.
See the full corporate responsibility report for details, calculation methods and further information on how
Experian is minimising its environmental impact at www.experianplc.com/crreport. Where emission factors
have changed, we have applied the most recent factors retrospectively.
1. CO2 equivalent. 2. Against a 2013 base.
27%
32%
35%
32%
30%
10
10
12
12
11
11
13
13
64%
66 %
68%
69%
69%
10
12
11
13
14
14
14
Experian Group employee engagement
Towers Watson Global High Performing Companies Norm1
72% 84%
75% 84%
74% 84%
11
12
14
P14
P52