Experian 2014 Annual Report Download - page 157
Download and view the complete annual report
Please find page 157 of the 2014 Experian annual report below. You can navigate through the pages in the report by either clicking on the pages listed below, or by using the keyword search tool below to find specific information within the annual report.-
 1
1 -
2
-
3
-
4
-
5
-
6
-
7
-
8
-
9
-
10
-
11
-
12
-
13
-
14
-
15
-
16
-
17
-
18
-
19
-
20
-
21
-
22
-
23
-
24
-
25
-
26
-
27
-
28
-
29
-
30
-
31
-
32
-
33
-
34
-
35
-
36
-
37
-
38
-
39
-
40
-
41
-
42
-
43
-
44
-
45
-
46
-
47
-
48
-
49
-
50
-
51
-
52
-
53
-
54
-
55
-
56
-
57
-
58
-
59
-
60
-
61
-
62
-
63
-
64
-
65
-
66
-
67
-
68
-
69
-
70
-
71
-
72
-
73
-
74
-
75
-
76
-
77
-
78
-
79
-
80
-
81
-
82
-
83
-
84
-
85
-
86
-
87
-
88
-
89
-
90
-
91
-
92
-
93
-
94
-
95
-
96
-
97
-
98
-
99
-
100
-
101
-
102
-
103
-
104
-
105
-
106
-
107
-
108
-
109
-
110
-
111
-
112
-
113
-
114
-
115
-
116
-
117
-
118
-
119
-
120
-
121
-
122
-
123
-
124
-
125
-
126
-
127
-
128
-
129
-
130
-
131
-
132
-
133
-
134
-
135
-
136
-
137
-
138
-
139
-
140
-
141
-
142
-
143
-
144
-
145
-
146
-
 147
147 -
 148
148 -
 149
149 -
 150
150 -
 151
151 -
 152
152 -
 153
153 -
 154
154 -
 155
155 -
 156
156 -
 157
157 -
 158
158 -
 159
159 -
 160
160 -
 161
161 -
 162
162 -
 163
163 -
 164
164 -
 165
165 -
 166
166 -
 167
167 -
168
-
169
-
170
-
171
-
172
-
173
-
174
-
175
-
176
-
177
-
178
 |
 |

Financial statements • Notes to the Group financial statements 153
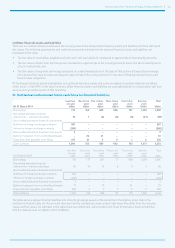
(ii) Movements in gross deferred tax assets and liabilities
Assets
Accelerated
depreciation
US$m
Intangibles
US$m
Share
incentive
plans
US$m
Tax losses
US$m
Other
temporary
differences
US$m
Total
US$m
At 1 April 2013 22 619 53 303 172 1,169
Differences on exchange 2 (62) – – (1) (61)
Tax (charge)/credit in the Group income
statement – continuing operations 3 3 (3) (133) 12 (118)
Business combinations – – – 34 – 34
Tax recognised within other
comprehensive income – – – – 4 4
Tax recognised directly in equity
on transactions with owners – – (13) – – (13)
Other transfers – (1) – 23 (32) (10)
At 31 March 2014 27 559 37 227 155 1,005
Assets
Accelerated
depreciation
US$m
Intangibles
US$m
Share
incentive
plans
US$m
Tax losses
US$m
Other
temporary
differences
US$m
Total
US$m
At 1 April 2012 24 24 58 300 140 546
Differences on exchange – – – – 3 3
Tax (charge)/credit in the Group income
statement – continuing operations (2) 133 1 (74) 5 63
Tax credit in the Group income
statement – discontinued operations – – – 77 10 87
Tax recognised within other
comprehensive income – – – – 13 13
Tax recognised directly in equity
on transactions with owners – 462 (6) – – 456
Other transfers – – – – 1 1
At 31 March 2013 22 619 53 303 172 1,169
Liabilities
Accelerated tax
depreciation
US$m
Intangibles
US$m
Other
temporary
differences
US$m
Total
US$m
At 1 April 2013 32 683 33 748
Differences on exchange – (29) 1 (28)
Tax charge in the Group income statement – continuing operations 6 40 (1) 45
Business combinations – 204 – 204
Other transfers – (4) (8) (12)
At 31 March 2014 38 894 25 957
Liabilities
Accelerated tax
depreciation
US$m
Intangibles
US$m
Other
temporary
differences
US$m
Total
US$m
At 1 April 2012 48 531 26 605
Differences on exchange – (28) 2 (26)
Tax (credit)/charge in the Group income statement – continuing operations (16) 42 4 30
Tax charge in the Group income statement – discontinued operations – 100 – 100
Business combinations – 3 – 3
Transfer in respect of liabilities held for sale – 36 – 36
Other transfers – (1) 1 –
At 31 March 2013 32 683 33 748
The movements in gross deferred tax assets and liabilities shown above do not take into consideration the offsetting of assets and
liabilities within the same tax jurisdiction.