Experian 2014 Annual Report Download - page 45
Download and view the complete annual report
Please find page 45 of the 2014 Experian annual report below. You can navigate through the pages in the report by either clicking on the pages listed below, or by using the keyword search tool below to find specific information within the annual report.-
 1
1 -
2
-
3
-
4
-
5
-
6
-
7
-
8
-
9
-
10
-
11
-
12
-
13
-
14
-
15
-
16
-
17
-
18
-
19
-
20
-
21
-
22
-
23
-
24
-
25
-
26
-
27
-
28
-
29
-
30
-
31
-
32
-
33
-
34
-
 35
35 -
 36
36 -
 37
37 -
 38
38 -
 39
39 -
 40
40 -
 41
41 -
 42
42 -
 43
43 -
 44
44 -
 45
45 -
 46
46 -
 47
47 -
 48
48 -
 49
49 -
 50
50 -
 51
51 -
 52
52 -
 53
53 -
 54
54 -
 55
55 -
56
-
57
-
58
-
59
-
60
-
61
-
62
-
63
-
64
-
65
-
66
-
67
-
68
-
69
-
70
-
71
-
72
-
73
-
74
-
75
-
76
-
77
-
78
-
79
-
80
-
81
-
82
-
83
-
84
-
85
-
86
-
87
-
88
-
89
-
90
-
91
-
92
-
93
-
94
-
95
-
96
-
97
-
98
-
99
-
100
-
101
-
102
-
103
-
104
-
105
-
106
-
107
-
108
-
109
-
110
-
111
-
112
-
113
-
114
-
115
-
116
-
117
-
118
-
119
-
120
-
121
-
122
-
123
-
124
-
125
-
126
-
127
-
128
-
129
-
130
-
131
-
132
-
133
-
134
-
135
-
136
-
137
-
138
-
139
-
140
-
141
-
142
-
143
-
144
-
145
-
146
-
147
-
148
-
149
-
150
-
151
-
152
-
153
-
154
-
155
-
156
-
157
-
158
-
159
-
160
-
161
-
162
-
163
-
164
-
165
-
166
-
167
-
168
-
169
-
170
-
171
-
172
-
173
-
174
-
175
-
176
-
177
-
178
 |
 |

Strategic report • EMEA/Asia Pacic
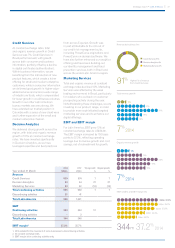
Credit Services
Total and organic revenue growth at
constant exchange rates was 2%. While
market conditions in the Eurozone
remained mixed, we saw stability,
recovery and growth across some of our
major bureau markets, including Spain,
Netherlands and South Africa, offsetting
weakness elsewhere. We also delivered
good growth across our business
information bureaux in China and
Singapore, and we were pleased to realise
a small first-time revenue contribution
from our new bureau in Australia towards
the end of the year.
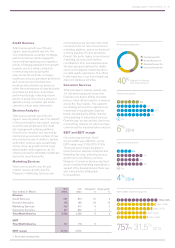
Decision Analytics
Total and organic revenue growth at
constant exchange rates was 11%
and 10% respectively. Our actions
to reposition our Decision Analytics
operations in EMEA have been successful
and the business returned strongly
to growth during the year, driven by
demand for PowerCurve software, fraud
prevention products, analytics and
collections software. During the year, we
undertook similar actions to reposition
our Asia Pacific operations, to focus on
our most significant opportunities, and
we were pleased to secure a number of
new PowerCurve and fraud prevention
deployments towards the end of the year.
Marketing Services
Total revenue growth at constant
exchange rates was 2%, while organic
revenue declined 3%. The decline in
Marketing Services was due to the
wind-down of a large email contract in
EMEA, as we have previously announced.
Excluding this one-off item, Marketing
Services performed well, with a good
reception for our combined approach and
particularly for our new cross-channel
marketing platform, which has led to a
number of new client wins during the year,
with a good pipeline of prospects.
EBIT and EBIT margin
In EMEA/Asia Pacific, EBIT from
continuing activities was US$7m (2013:
US$20m). The reduction in profitability
was largely due to ramp-up in investment
in the Australian bureau development and
the impact of the wind-down of the large
client contract in EMEA, referred to above.
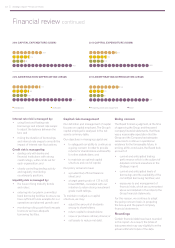
7
m 1.4% 2014
38%
Credit Services 38%
Decision Analytics 25%
Marketing Services 37%
4% 2014
2% 2014
Highest % of revenue
from Credit Services
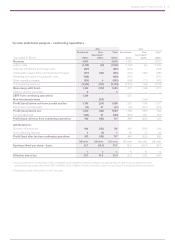
Year ended 31 March
2014
US$m
20131
US$m
Total grow th2
%
Organic growth
2
%
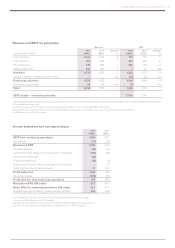
Revenue
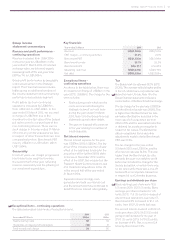
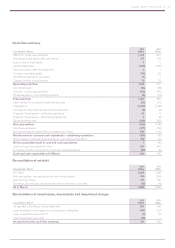
Credit Services 187 186 2 2
Decision Analytics 127 116 11 10
Marketing Services 185 189 2(3)
Total continuing activities 499 491 4 2
Discontinuing activities 47 107
Total EMEA/Asia Pacific 546 598
EBIT
Continuing activities 720 (60)
Discontinuing activities (3) 4
Total EMEA/Asia Pacific 424
EBIT margin31.4% 4.1%
1. 2013 restated for the movement of some businesses to discontinuing activities.
2. At constant exchange rates.
3. EBIT margin is for continuing activities only.
2%
7%
7%
3%
1%
10
12
11
13
14
4%
6%
12%
17%
4%
10
12
11
13
14
7m 1.4%
38m 6.6%
52m 10.4%
51m 11. 2%
20m 4.1%
10
12
11
13
14
41
EBIT (US$m) and EBIT margin (%)
Revenue by business line
Total revenue growth
Organic revenue growth