Experian 2014 Annual Report Download - page 133
Download and view the complete annual report
Please find page 133 of the 2014 Experian annual report below. You can navigate through the pages in the report by either clicking on the pages listed below, or by using the keyword search tool below to find specific information within the annual report.-
 1
1 -
2
-
3
-
4
-
5
-
6
-
7
-
8
-
9
-
10
-
11
-
12
-
13
-
14
-
15
-
16
-
17
-
18
-
19
-
20
-
21
-
22
-
23
-
24
-
25
-
26
-
27
-
28
-
29
-
30
-
31
-
32
-
33
-
34
-
35
-
36
-
37
-
38
-
39
-
40
-
41
-
42
-
43
-
44
-
45
-
46
-
47
-
48
-
49
-
50
-
51
-
52
-
53
-
54
-
55
-
56
-
57
-
58
-
59
-
60
-
61
-
62
-
63
-
64
-
65
-
66
-
67
-
68
-
69
-
70
-
71
-
72
-
73
-
74
-
75
-
76
-
77
-
78
-
79
-
80
-
81
-
82
-
83
-
84
-
85
-
86
-
87
-
88
-
89
-
90
-
91
-
92
-
93
-
94
-
95
-
96
-
97
-
98
-
99
-
100
-
101
-
102
-
103
-
104
-
105
-
106
-
107
-
108
-
109
-
110
-
111
-
112
-
113
-
114
-
115
-
116
-
117
-
118
-
119
-
120
-
121
-
122
-
 123
123 -
 124
124 -
 125
125 -
 126
126 -
 127
127 -
 128
128 -
 129
129 -
 130
130 -
 131
131 -
 132
132 -
 133
133 -
 134
134 -
 135
135 -
 136
136 -
 137
137 -
 138
138 -
 139
139 -
 140
140 -
 141
141 -
 142
142 -
 143
143 -
144
-
145
-
146
-
147
-
148
-
149
-
150
-
151
-
152
-
153
-
154
-
155
-
156
-
157
-
158
-
159
-
160
-
161
-
162
-
163
-
164
-
165
-
166
-
167
-
168
-
169
-
170
-
171
-
172
-
173
-
174
-
175
-
176
-
177
-
178
 |
 |

Financial statements • Notes to the Group financial statements 129
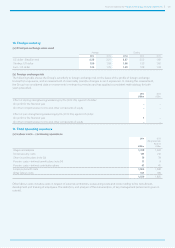
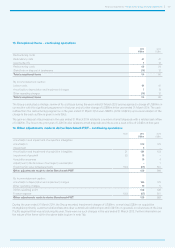
(d) Interest rate risk
The following table shows the Group’s sensitivity to interest rate risk on the basis of the profile of net debt at the balance sheet dates
and an assessment of reasonably possible changes in the principal interest rates, with all other variables held constant. In making
this assessment, the Group has considered movements in relevant interest rates over the most recent three-year period and has
applied a consistent methodology for both years presented. An indication of the primary cause of the reported sensitivity of profit for
the financial year is included.
(Loss)/gain
2014
US$m
2013
US$m
Effect of an increase of 0.1% (2013: 0.1%) on US dollar denominated net debt:
Due to fair value gains on interest rate swaps offset by higher interest on floating rate borrowings (11) 4
Effect of an increase of 0.1% (2013: 0.1%) on sterling denominated net debt:
Due to the revaluation of borrowings and related derivatives (1) (3)
Effect of an increase of 2.4% (2013: 2.4%) on Brazilian real denominated net debt:
Due to higher interest income on cash and cash equivalents 2 2
Effect of an increase of 0.5% (2013: 0.6%) on euro denominated net debt:
Due to fair value gains on interest rate swaps offset by higher interest on floating rate borrowings (1) (3)
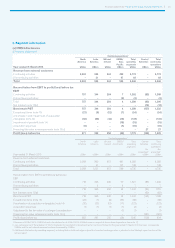
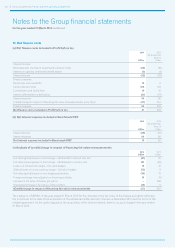
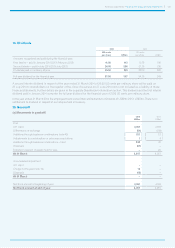
16. Tax charge in the Group income statement
(a) Analysis of Group tax charge
2014
US$m
2013
(Re-presented)
(Note 3)
US$m
Current tax:
Tax on income for the year 159 224
Adjustments in respect of prior years (20) (40)
Total current tax charge 139 184
Deferred tax:
Origination and reversal of temporary differences 171 (47)
Adjustments in respect of prior years (8) 14
Total deferred tax charge/(credit) 163 (33)
Group tax charge 302 151
The Group tax charge comprises:
UK tax 71 4
Non-UK tax 231 147
302 151