Experian 2014 Annual Report Download - page 144
Download and view the complete annual report
Please find page 144 of the 2014 Experian annual report below. You can navigate through the pages in the report by either clicking on the pages listed below, or by using the keyword search tool below to find specific information within the annual report.-
 1
1 -
2
-
3
-
4
-
5
-
6
-
7
-
8
-
9
-
10
-
11
-
12
-
13
-
14
-
15
-
16
-
17
-
18
-
19
-
20
-
21
-
22
-
23
-
24
-
25
-
26
-
27
-
28
-
29
-
30
-
31
-
32
-
33
-
34
-
35
-
36
-
37
-
38
-
39
-
40
-
41
-
42
-
43
-
44
-
45
-
46
-
47
-
48
-
49
-
50
-
51
-
52
-
53
-
54
-
55
-
56
-
57
-
58
-
59
-
60
-
61
-
62
-
63
-
64
-
65
-
66
-
67
-
68
-
69
-
70
-
71
-
72
-
73
-
74
-
75
-
76
-
77
-
78
-
79
-
80
-
81
-
82
-
83
-
84
-
85
-
86
-
87
-
88
-
89
-
90
-
91
-
92
-
93
-
94
-
95
-
96
-
97
-
98
-
99
-
100
-
101
-
102
-
103
-
104
-
105
-
106
-
107
-
108
-
109
-
110
-
111
-
112
-
113
-
114
-
115
-
116
-
117
-
118
-
119
-
120
-
121
-
122
-
123
-
124
-
125
-
126
-
127
-
128
-
129
-
130
-
131
-
132
-
133
-
 134
134 -
 135
135 -
 136
136 -
 137
137 -
 138
138 -
 139
139 -
 140
140 -
 141
141 -
 142
142 -
 143
143 -
 144
144 -
 145
145 -
 146
146 -
 147
147 -
 148
148 -
 149
149 -
 150
150 -
 151
151 -
 152
152 -
 153
153 -
 154
154 -
155
-
156
-
157
-
158
-
159
-
160
-
161
-
162
-
163
-
164
-
165
-
166
-
167
-
168
-
169
-
170
-
171
-
172
-
173
-
174
-
175
-
176
-
177
-
178
 |
 |

Financial statements • Notes to the Group financial statements
Notes to the Group financial statements
for the year ended 31 March 2014 continued
140
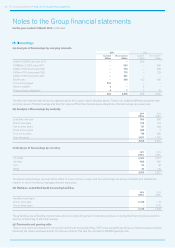
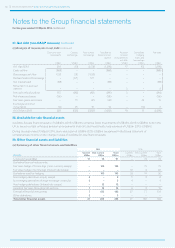
26. Borrowings
(a) Analysis of borrowings by carrying amounts
2014 2013
Current
US$m
Non-current
US$m
Current
US$m
Non-current
US$m
£334m 5.625% Euronotes 2013 – – 529 –
US$600m 2.375% notes 2017 – 599 – 602
£400m 4.75% Euronotes 2018 – 718 – 693
€500m 4.75% Euronotes 2020 – 775 – 729
£400m 3.50% Euronotes 2021 – 661 – –
Bank loans – 816 100 590
Commercial paper 576 – – –
Bank overdrafts 4 – 3 –
Finance lease obligations 4 7 3 12
584 3,576 635 2,626
The effective interest rates for bonds approximate to the coupon rates indicated above. There is no material difference between the
carrying values of the borrowings and their fair values. Other than finance lease obligations, the borrowings are unsecured.
(b) Analysis of borrowings by maturity
2014
US$m
2013
US$m
Less than one year 584 635
One to two years 105 103
Two to three years 717 493
Three to four years 599 3
Four to five years 718 605
Over five years 1,437 1,422
4,160 3,261
(c) Analysis of borrowings by currency
2014
US$m
2013
US$m
US dollar 3,432 2,557
Sterling 662 542
Euro 23 46
Other 43 116
4,160 3,261
The above analysis takes account of the effect of cross currency swaps and forward foreign exchange contracts and reflects the
manner in which the Group manages relevant exposures.
(d) Undrawn committed bank borrowing facilities
2014
US$m
2013
US$m
Facilities expiring in:
One to two years 2,216 114
Two to three years – 1,510
2,216 1,624
These facilities are at floating interest rates and are in place for general corporate purposes, including the financing of acquisitions
and the re-financing of other borrowings.
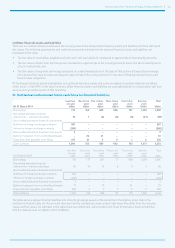
(e) Covenants and gearing ratio
There is one financial covenant in connection with the borrowing facilities. EBIT must exceed three times net interest expense before
financing fair value remeasurements. The Group monitors this and the net debt to EBITDA gearing ratio.