Experian 2014 Annual Report Download - page 53
Download and view the complete annual report
Please find page 53 of the 2014 Experian annual report below. You can navigate through the pages in the report by either clicking on the pages listed below, or by using the keyword search tool below to find specific information within the annual report.-
 1
1 -
2
-
3
-
4
-
5
-
6
-
7
-
8
-
9
-
10
-
11
-
12
-
13
-
14
-
15
-
16
-
17
-
18
-
19
-
20
-
21
-
22
-
23
-
24
-
25
-
26
-
27
-
28
-
29
-
30
-
31
-
32
-
33
-
34
-
35
-
36
-
37
-
38
-
39
-
40
-
41
-
42
-
 43
43 -
 44
44 -
 45
45 -
 46
46 -
 47
47 -
 48
48 -
 49
49 -
 50
50 -
 51
51 -
 52
52 -
 53
53 -
 54
54 -
 55
55 -
 56
56 -
 57
57 -
 58
58 -
 59
59 -
 60
60 -
 61
61 -
 62
62 -
 63
63 -
64
-
65
-
66
-
67
-
68
-
69
-
70
-
71
-
72
-
73
-
74
-
75
-
76
-
77
-
78
-
79
-
80
-
81
-
82
-
83
-
84
-
85
-
86
-
87
-
88
-
89
-
90
-
91
-
92
-
93
-
94
-
95
-
96
-
97
-
98
-
99
-
100
-
101
-
102
-
103
-
104
-
105
-
106
-
107
-
108
-
109
-
110
-
111
-
112
-
113
-
114
-
115
-
116
-
117
-
118
-
119
-
120
-
121
-
122
-
123
-
124
-
125
-
126
-
127
-
128
-
129
-
130
-
131
-
132
-
133
-
134
-
135
-
136
-
137
-
138
-
139
-
140
-
141
-
142
-
143
-
144
-
145
-
146
-
147
-
148
-
149
-
150
-
151
-
152
-
153
-
154
-
155
-
156
-
157
-
158
-
159
-
160
-
161
-
162
-
163
-
164
-
165
-
166
-
167
-
168
-
169
-
170
-
171
-
172
-
173
-
174
-
175
-
176
-
177
-
178
 |
 |

49
Strategic report • Financial review
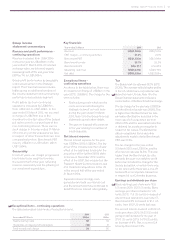
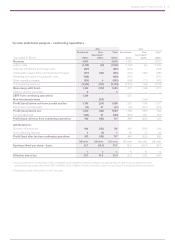
Income statement analysis – continuing operations
Year ended 31 March
2014 2013
Benchmark
US$m
Non-
benchmark1
US$m
Total
US$m
Benchmark2
US$m
Non-
benchmark1
US$m
Total2
US$m
Revenue 4,840 –4,840 4,730 –4,730
Labour costs (1,769) (61) (1,830) (1,794) (41) (1,835)
Data and information technology costs (481) –(481) (453) –(453)
Amortisation, depreciation and impairment charges (371) (153) (524) (329) (136) (465)
Marketing and customer acquisition costs (405) –(405) (375) –(375)
Other operating charges (510) 4(506) (528) (17) (545)
Total operating expenses (3,536) (210) (3,746) (3,479) (194) (3,673)
Operating profit/(loss) 1,304 (210) 1,094 1,251 (194) 1,057
Share of profit of associates 2 – 2 – – –
EBIT from continuing operations 1,306 1,251
Non-benchmark items (210) (194)
Profit/(loss) before net finance costs and tax 1,306 (210) 1,096 1,251 (194) 1,057
Net finance income/(costs) (74) 27 (47) (62) (561) (623)
Profit/(loss) before tax 1,232 (183) 1,049 1,189 (755) 434
Tax (charge)/credit (329) 27 (302) (301) 150 (151)
Profit/(loss) after tax from continuing operations 903 (156) 747 888 (605) 283
Attributable to:
Owners of Experian plc 899 (153) 746 842 (598) 244
Non-controlling interests 4(3) 146 (7) 39
Profit/(loss) after tax from continuing operations 903 (156) 747 888 (605) 283
US cents US cents US cents US cents US cents US cents
Earnings/(loss) per share – basic 91.7 (15.6) 76.1 85.2 (60.5) 24.7
% % % % % %
Effective rate of tax 26.7 14.8 28.8 25.3 19.9 34.8
1. The loss before tax for non-benchmark items of US$183m (2013: US$755m) comprises charges for exceptional items of US$54m (2013: US$66m) and other
adjustments made to derive Benchmark PBT of US$129m (2013: US$689m). Further information is given in notes 13 and 14 to the Group financial statements.
2. Restated as a result of the adoption of IAS 19 (revised).